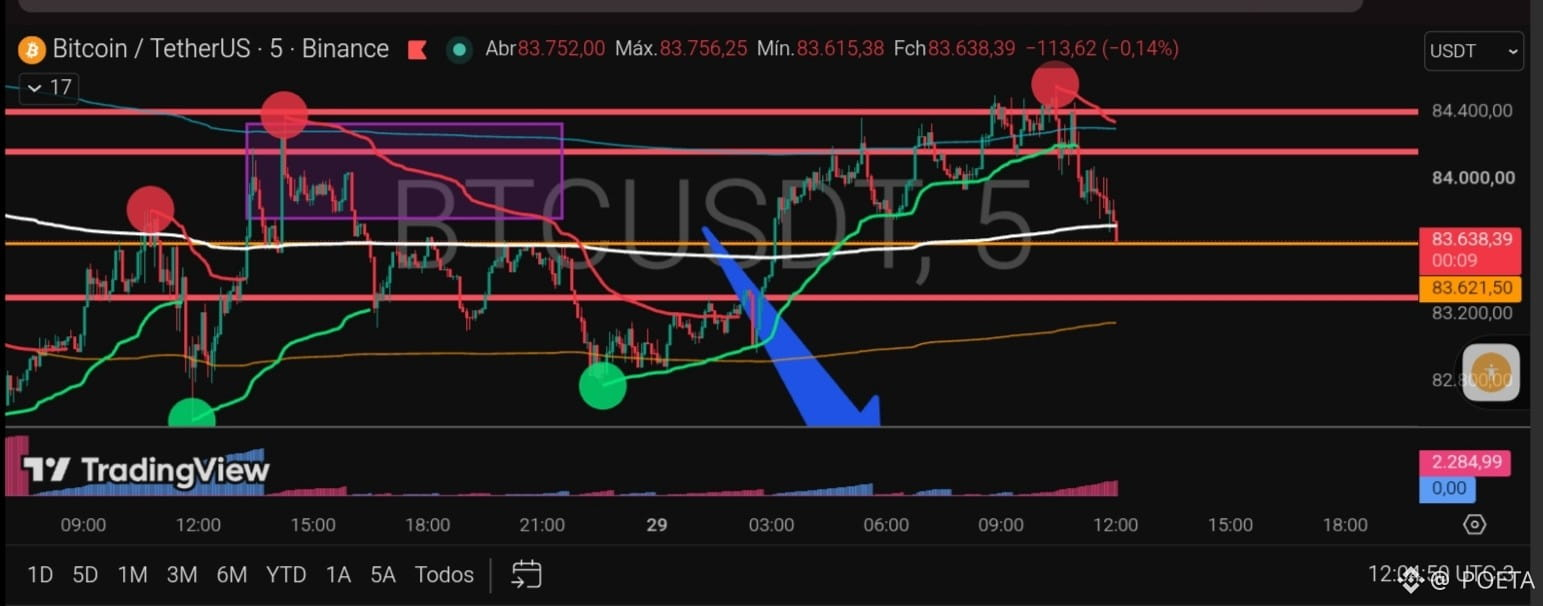
The 5-minute chart of the BTC/USDT pair shows a strong initial rebound from the green-marked minimum point (near $82,800), which led to an uptrend supported by the green moving average until it broke above $84,500; however, upon reaching the upper resistance zone identified by the red dot (near $84,600), the price suffered a sharp rejection and began a strong downward move that broke the short-term moving averages, accompanied by an increase in volume in the lower indicator, signaling a possible continuation of the downtrend toward lower support levels.