Whale Activity on Bitcoin Rises Again: Selling or Position Change?
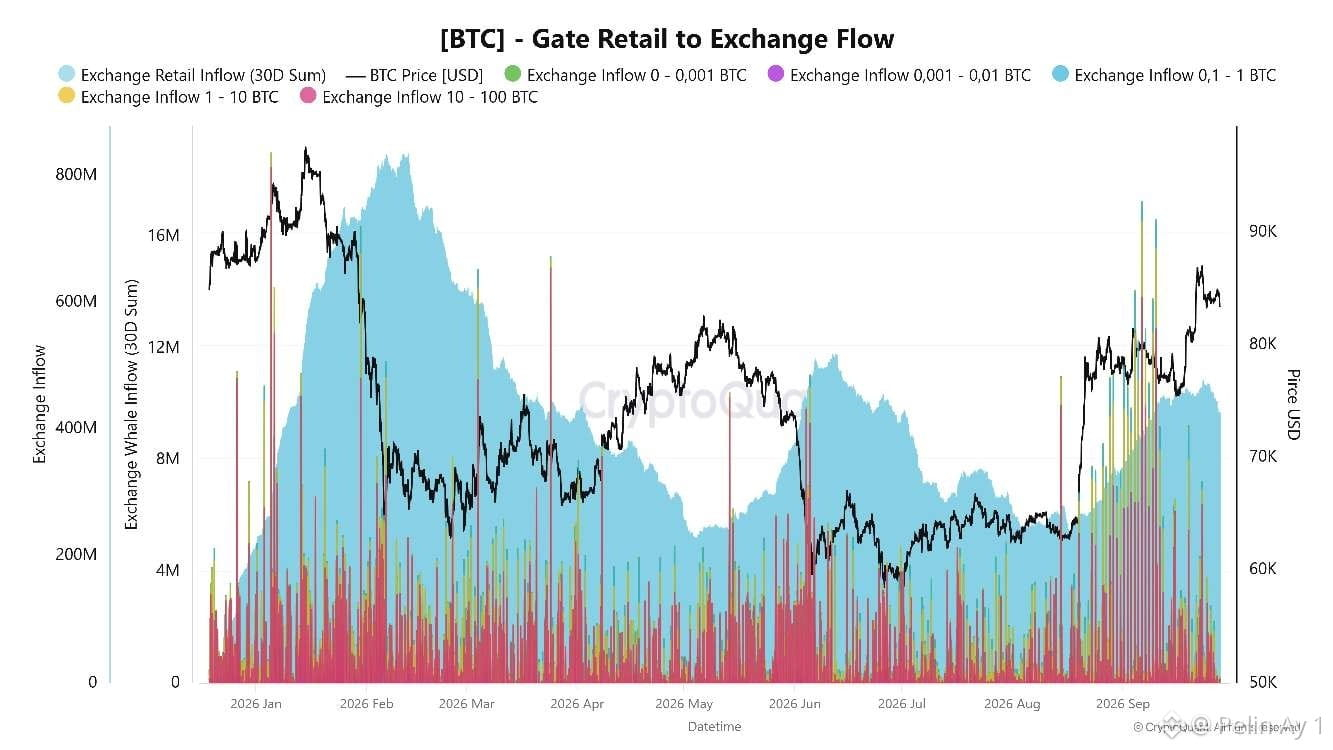
First, in the chart, as the Bitcoin price rises, it stands out that the amounts of BTC sent to exchanges increase noticeably, especially in September. In particular, the Gate transfers in the 1–10 BTC and 10–100 BTC ranges—which represent large transaction groups—appear much higher and more frequent in the current section of the chart. This suggests that whales have become more active in the market and that some wallets are moving BTC to exchange liquidity that can be used for trading. From a professional perspective, BTC entering exchanges could be prepared for sale, used as collateral, shifted between positions for different strategies, or moved for liquidity purposes.
As this activity increases during the period when the price rises from around the $75K area to above $87K, it raises the possibility that some whales may have used the move to create liquidity on the way up or to realize profits. Indeed, after BTC climbed to roughly $87.3K on September 21, it pulled back to around $84K.
In the current chart, in my view, the risk of profit-taking in the short term is increasing, but there is not yet confirmation of a strong whale selloff. This is because as the price quickly moved from the $75–77K area into the $85–87K range, large transfers also increased. This suggests that more BTC liquidity is coming into the market during the rally and that the $84–87K zone could turn into a significant supply area.
On the other hand, strong inflows in US spot Bitcoin ETFs during the last weeks of September and a speeding up of exchange outflows across the market indicate that this sell supply is not completely dominant at this stage. So, we can say that whales are active in the chart.
Keeping BTC around the $84K area and testing the $86–87K range again will be important to understand whether the high inflows on Gate are being absorbed or not.
$BTC #BTC
First, in the chart, as the Bitcoin price rises, it stands out that the amounts of BTC sent to exchanges increase noticeably, especially in September. In particular, the Gate transfers in the 1–10 BTC and 10–100 BTC ranges—which represent large transaction groups—appear much higher and more frequent in the current section of the chart. This suggests that whales have become more active in the market and that some wallets are moving BTC to exchange liquidity that can be used for trading. From a professional perspective, BTC entering exchanges could be prepared for sale, used as collateral, shifted between positions for different strategies, or moved for liquidity purposes.
As this activity increases during the period when the price rises from around the $75K area to above $87K, it raises the possibility that some whales may have used the move to create liquidity on the way up or to realize profits. Indeed, after BTC climbed to roughly $87.3K on September 21, it pulled back to around $84K.
In the current chart, in my view, the risk of profit-taking in the short term is increasing, but there is not yet confirmation of a strong whale selloff. This is because as the price quickly moved from the $75–77K area into the $85–87K range, large transfers also increased. This suggests that more BTC liquidity is coming into the market during the rally and that the $84–87K zone could turn into a significant supply area.
On the other hand, strong inflows in US spot Bitcoin ETFs during the last weeks of September and a speeding up of exchange outflows across the market indicate that this sell supply is not completely dominant at this stage. So, we can say that whales are active in the chart.
Keeping BTC around the $84K area and testing the $86–87K range again will be important to understand whether the high inflows on Gate are being absorbed or not.
$BTC #BTC