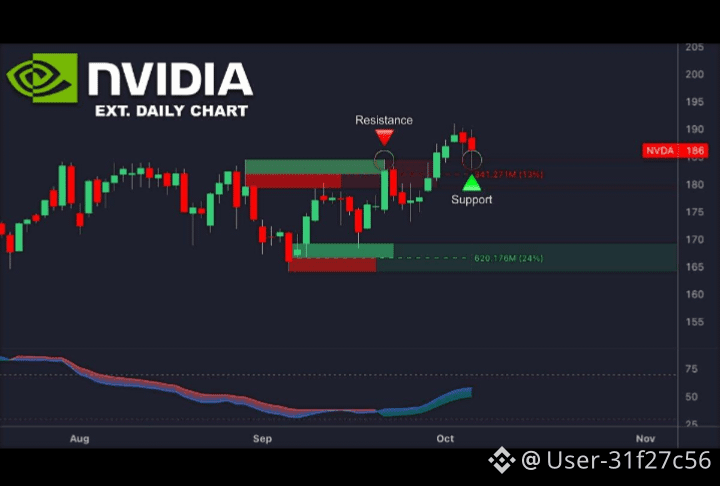
📊 NVDAUSDT Latest Analysis
$NVDA Price reference: ~$225.07 for NVDA’s latest close. �
MarketBeat +1
Trend: Short-term consolidation after a strong September rebound.
Resistance: $227–230
Support: $222, then $218–220
Bullish: Break above $230 could open the way toward $235–240.
Bearish: Losing $222 may bring a deeper pullback toward $218–220.
Bias: Neutral-to-bullish above $222; wait for confirmation before entering. �
Investing.com
*NVDAUSDT is an exchange-specific/tokenized pair, so its exact price can differ slightly from NVDA stock.*
#ChainlinkLaunchesCCIP2WithEnterpriseVerification #QNTFallsOver40%FromMorningHigh #KospiFalls2.7%SamsungSKHynixDropOver5% #BitgetDetailsSecurityIncidentTimeline #FedProposesPaymentStablecoinRules
$NVDA Price reference: ~$225.07 for NVDA’s latest close. �
MarketBeat +1
Trend: Short-term consolidation after a strong September rebound.
Resistance: $227–230
Support: $222, then $218–220
Bullish: Break above $230 could open the way toward $235–240.
Bearish: Losing $222 may bring a deeper pullback toward $218–220.
Bias: Neutral-to-bullish above $222; wait for confirmation before entering. �
Investing.com
*NVDAUSDT is an exchange-specific/tokenized pair, so its exact price can differ slightly from NVDA stock.*
#ChainlinkLaunchesCCIP2WithEnterpriseVerification #QNTFallsOver40%FromMorningHigh #KospiFalls2.7%SamsungSKHynixDropOver5% #BitgetDetailsSecurityIncidentTimeline #FedProposesPaymentStablecoinRules