

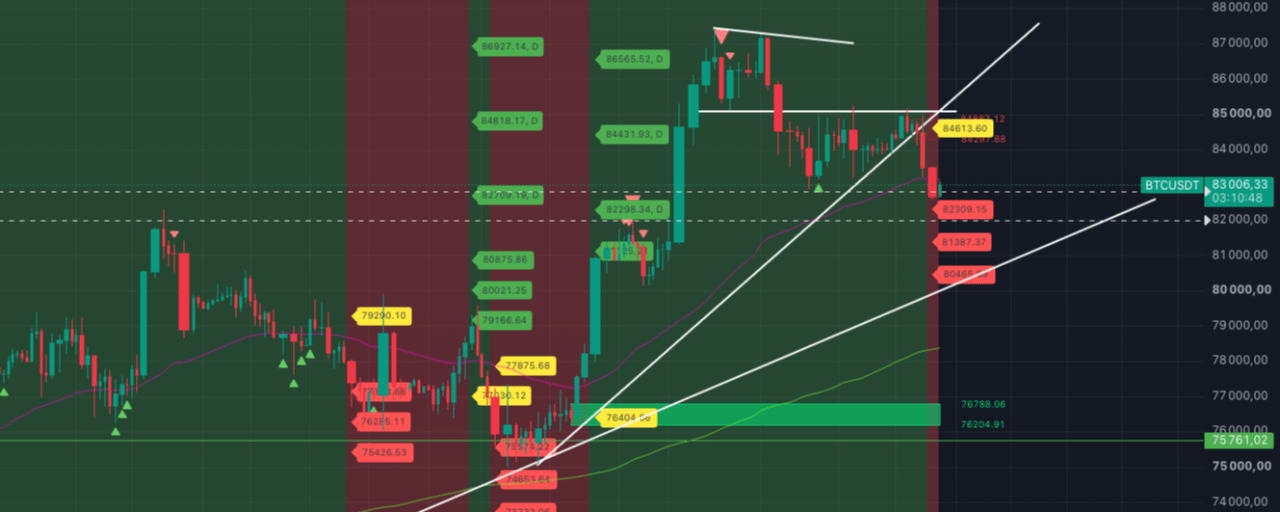


From the BTC breakdown of yesterday, we received a perfect execution of the potential high (haw) levels. Recall that yesterday we pointed out that at the "here and now" junction, either the sellers would trigger the fulfillment of the potential high markers on the 2- and 4-hour timeframes, or the buyers would push the price back up into the uptrend on the 3-hour timeframe.
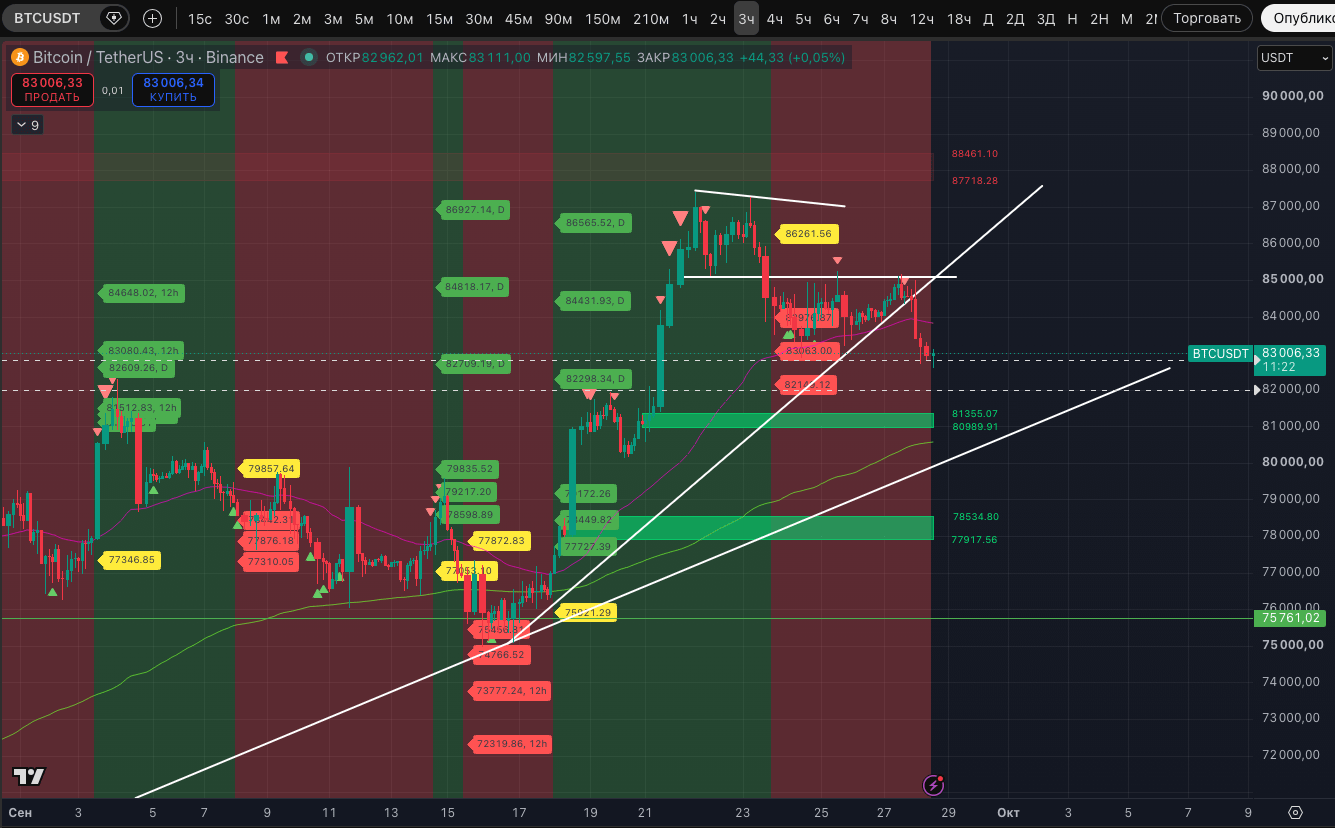
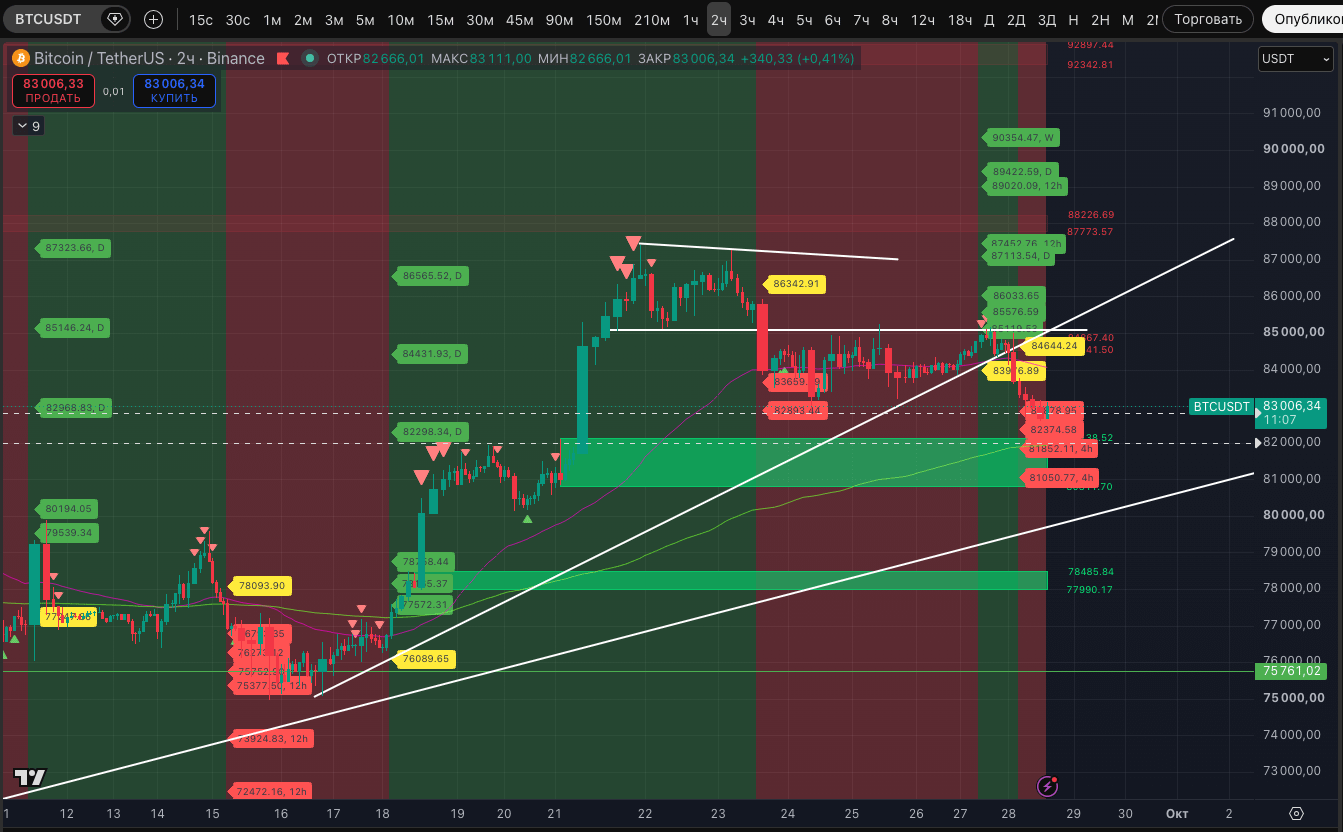
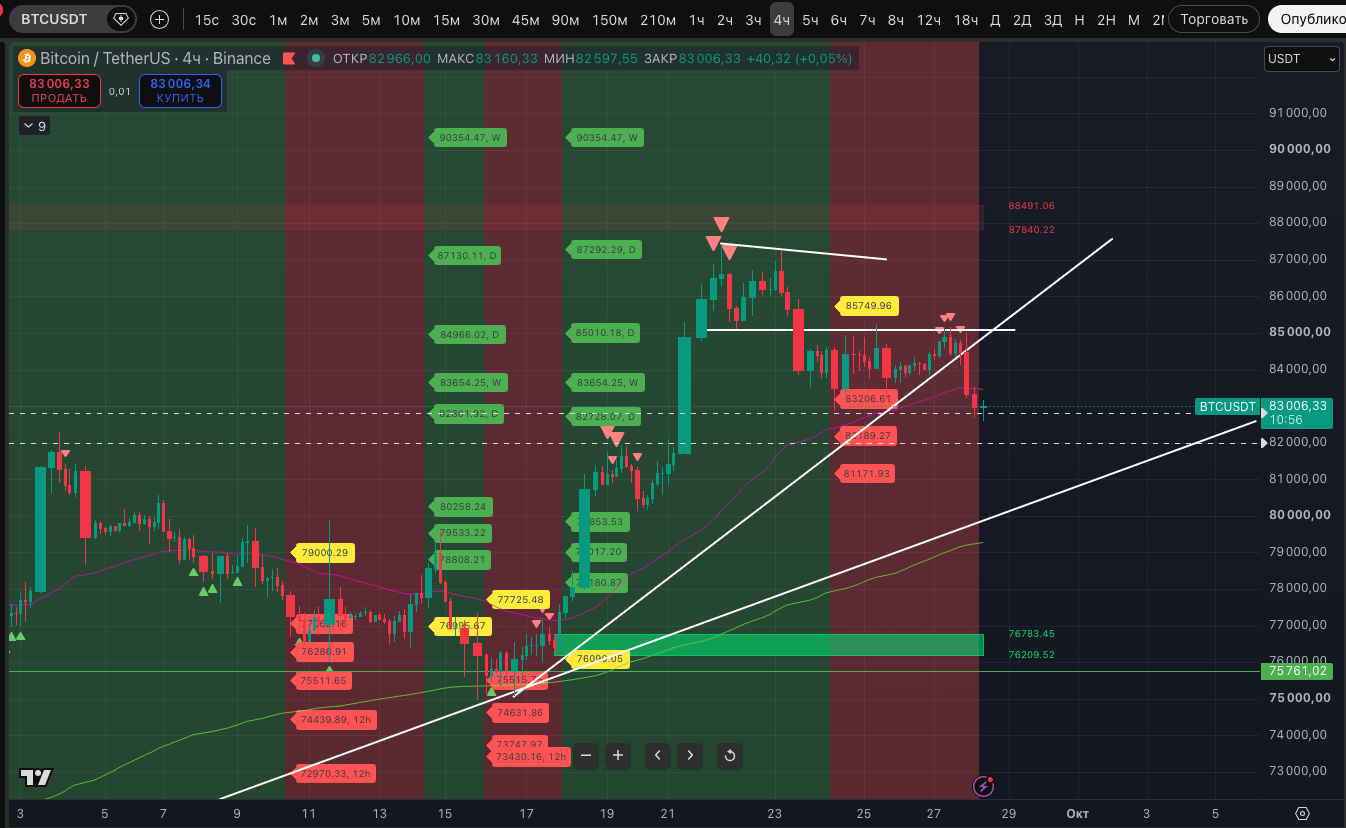
In the end, the markers performed their work and one of the trending growth supports was broken—from September 16. Now we’ll do the same for the trend support starting from August 16. At the moment, it’s in the area of $79,850 and serves as the next target for a test.
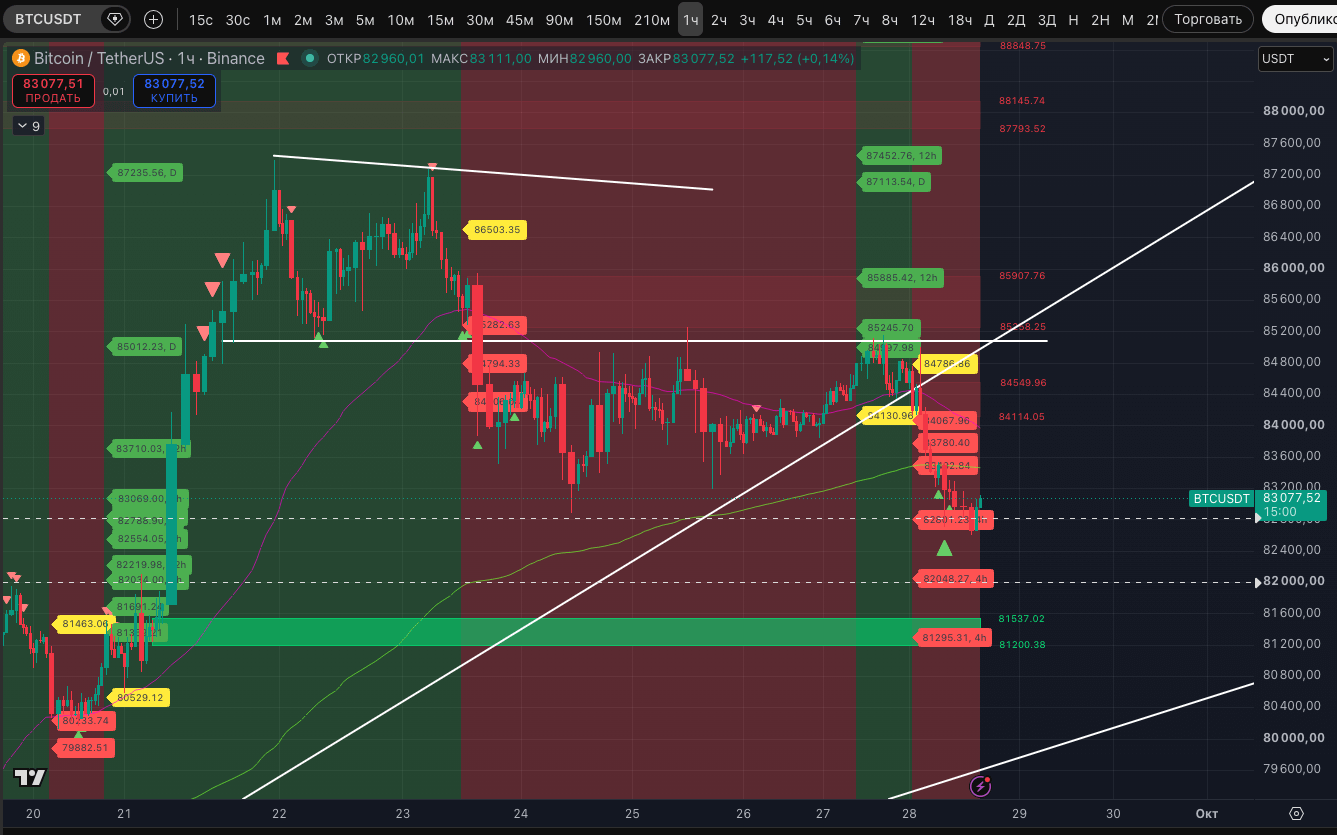
Today’s decline was quite prolonged and began right after the day opened. The price made a local short squeeze up to $85,000, after which it fell and set a low at $82,597. As can be seen from the screenshot of the 5-minute and hourly (!) timeframes, most of the impulse ended at the Strong signal potential low on those timeframes. After that, there was a rebound and then—a small re-break above the low. Right now, the price has returned to a steady uptrend on the 5-minute timeframe, but to say that growth is back—we consider that clearly premature.
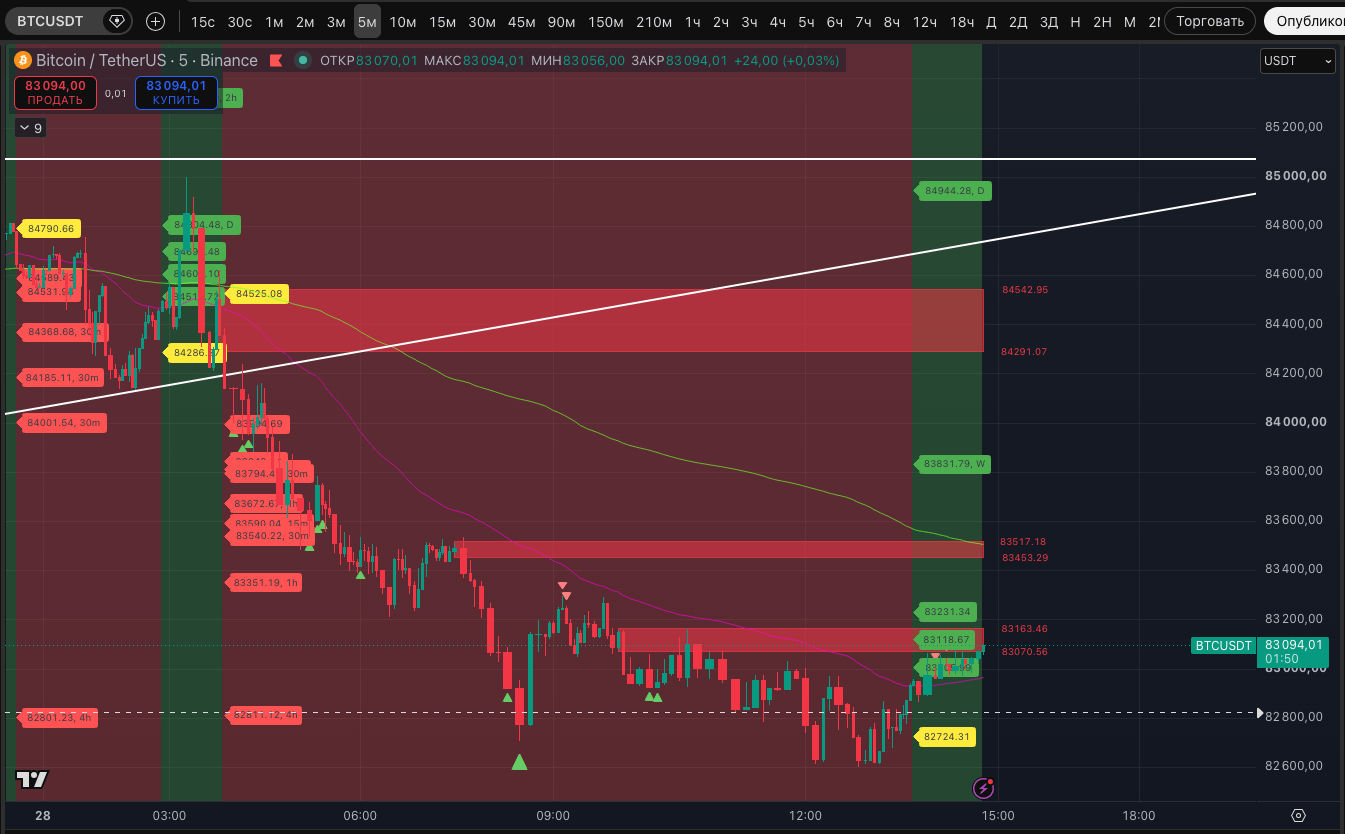
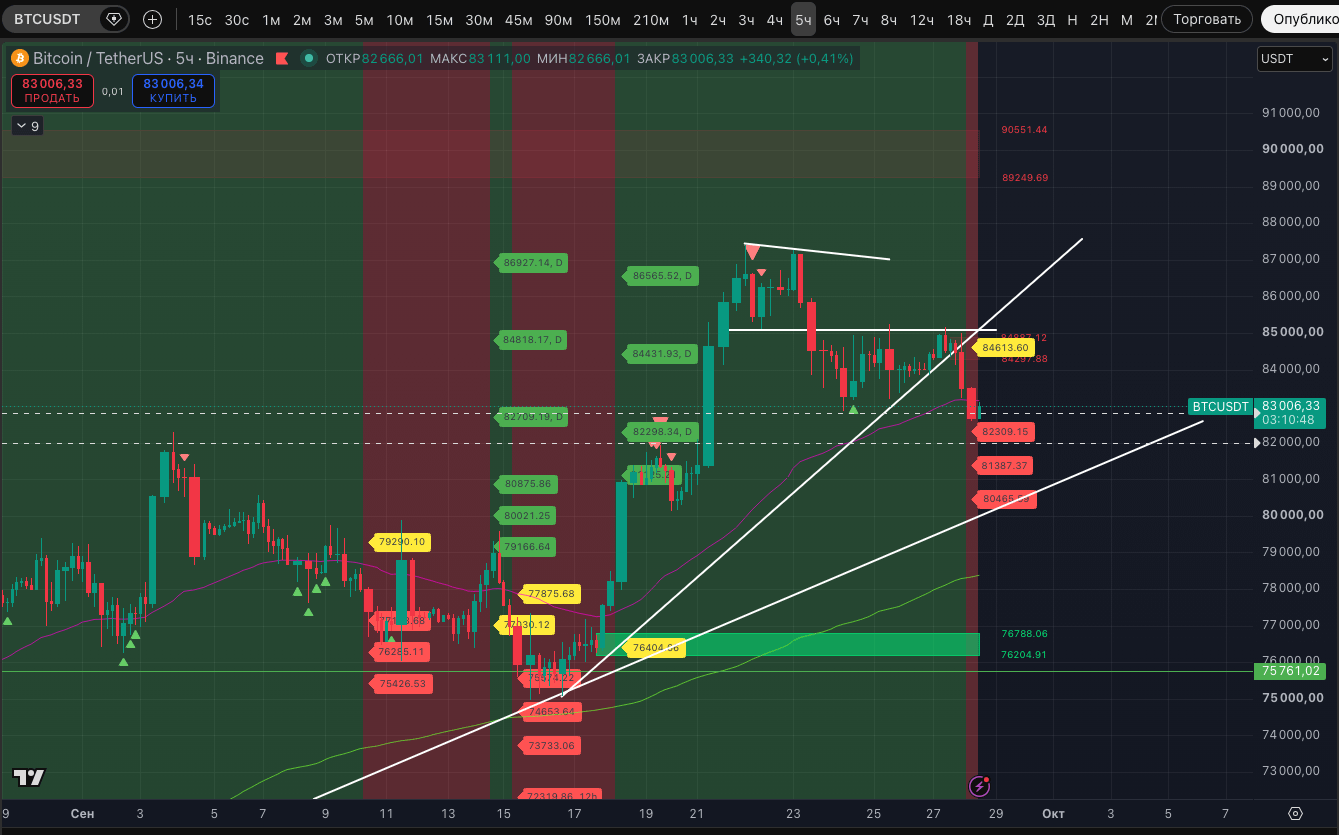
The local (!) picture is becoming more and more bearish overall, and the proof is that the price has moved into a steady downtrend on the 5-hour timeframe, with baseline targets of $82,309, $81,387, and $80,465. The potential break level is $84,613.
Considering the broader picture across the TOP-200 crypto assets, we have clear and pronounced extreme-point signals. When 41 of the TOP-200 assets show a potential high marker on the weekly timeframe (and another 9 show a Strong signal for a potential high marker on this timeframe), the signal looks very convincing—and the only thing that raises a question is whether we now have a real start of the correction with the execution of this signal, or whether until October 18 (the deadline for the candle close with a possible third potential high marker) we can still expect a bounce with a revisit. Here, there’s only one thing left—to follow the trend. As it’s visible so far, locally the sustained trends are on the side of the bears.
With extreme-point signals locally, it’s not so straightforward, because after all, the Strong signal for a low on the hourly timeframe is significant—especially under bullish conditions (we are in them, until the broken upside trend on the weekly timeframe is proven otherwise). If this signal is broken, it will be even more meaningful for the bears at that moment. The probability of that is not zero, because overall, by the markers, the picture is indeed corrective. After the Strong high signal on the 12-hour timeframe was joined by the high marker on the weekly timeframe—there’s definitely more reason.
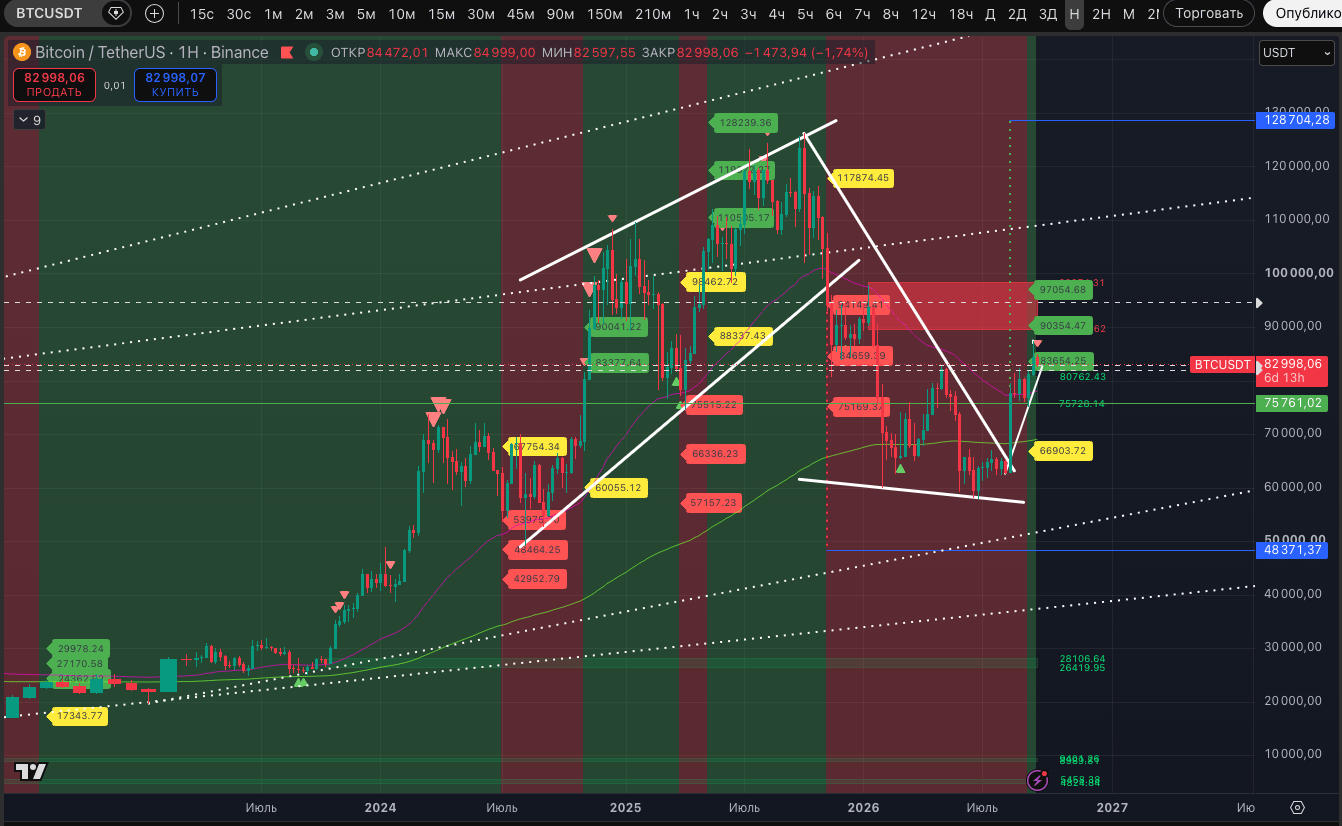
We show the picture from 2023, when the markers appeared and how they were played out on the weekly timeframe. Of course, there’s an example of a bull run in 2023–2024 when they broke. But there are also examples from 2024–2025 when they served as a signal to exit. Including in August 2025.
A potential high marker on the weekly timeframe is definitely not a time for profitable buys if the asset is already showing weakness (and the downtrend on the 3-hour timeframe makes it clear that weakness exists).
Separately, let’s note the situation with the horizontal levels. On the hourly timeframe, our indicator shows a struggle around $82,945, which already halted a correction on September 24. Now, after a squeeze under it, the price was able to recover above it. BUT if it returns below it, you can expect a new impulsive decline. Between $82,945 and $81,239 there’s a gap—this is the zone of impulsive moves.
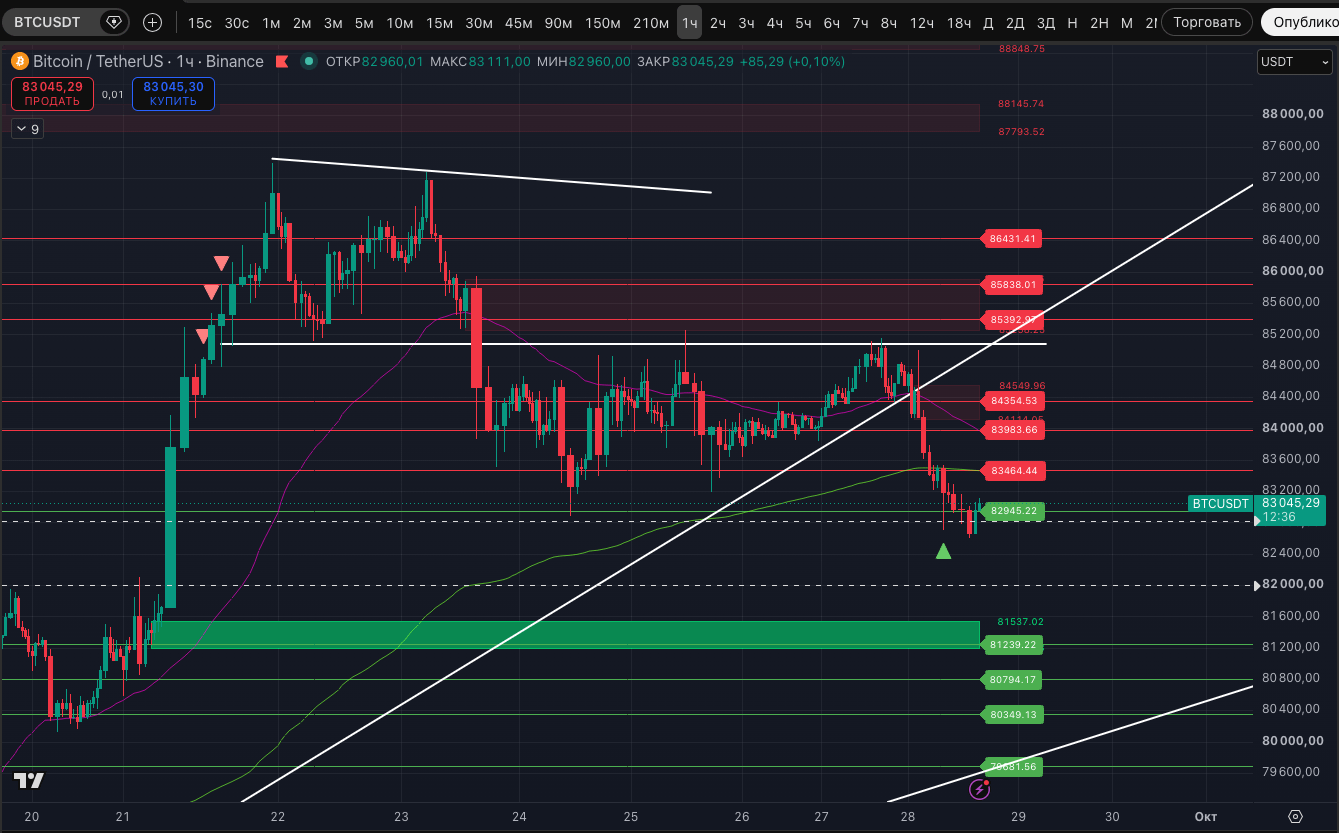
Plus, the nearest liquidity zone at the bottom on the hourly timeframe is the neighboring zone to the $81,200–$81,537 level. So the price will most likely be brought there for a test. But it will start only after the next hourly candle closes below $82,945.