$HBAR 👍 Analysis – Frame (1 hour)
Buy and sell deal 🚨🔥🚨🚩
📊 Support and resistance levels
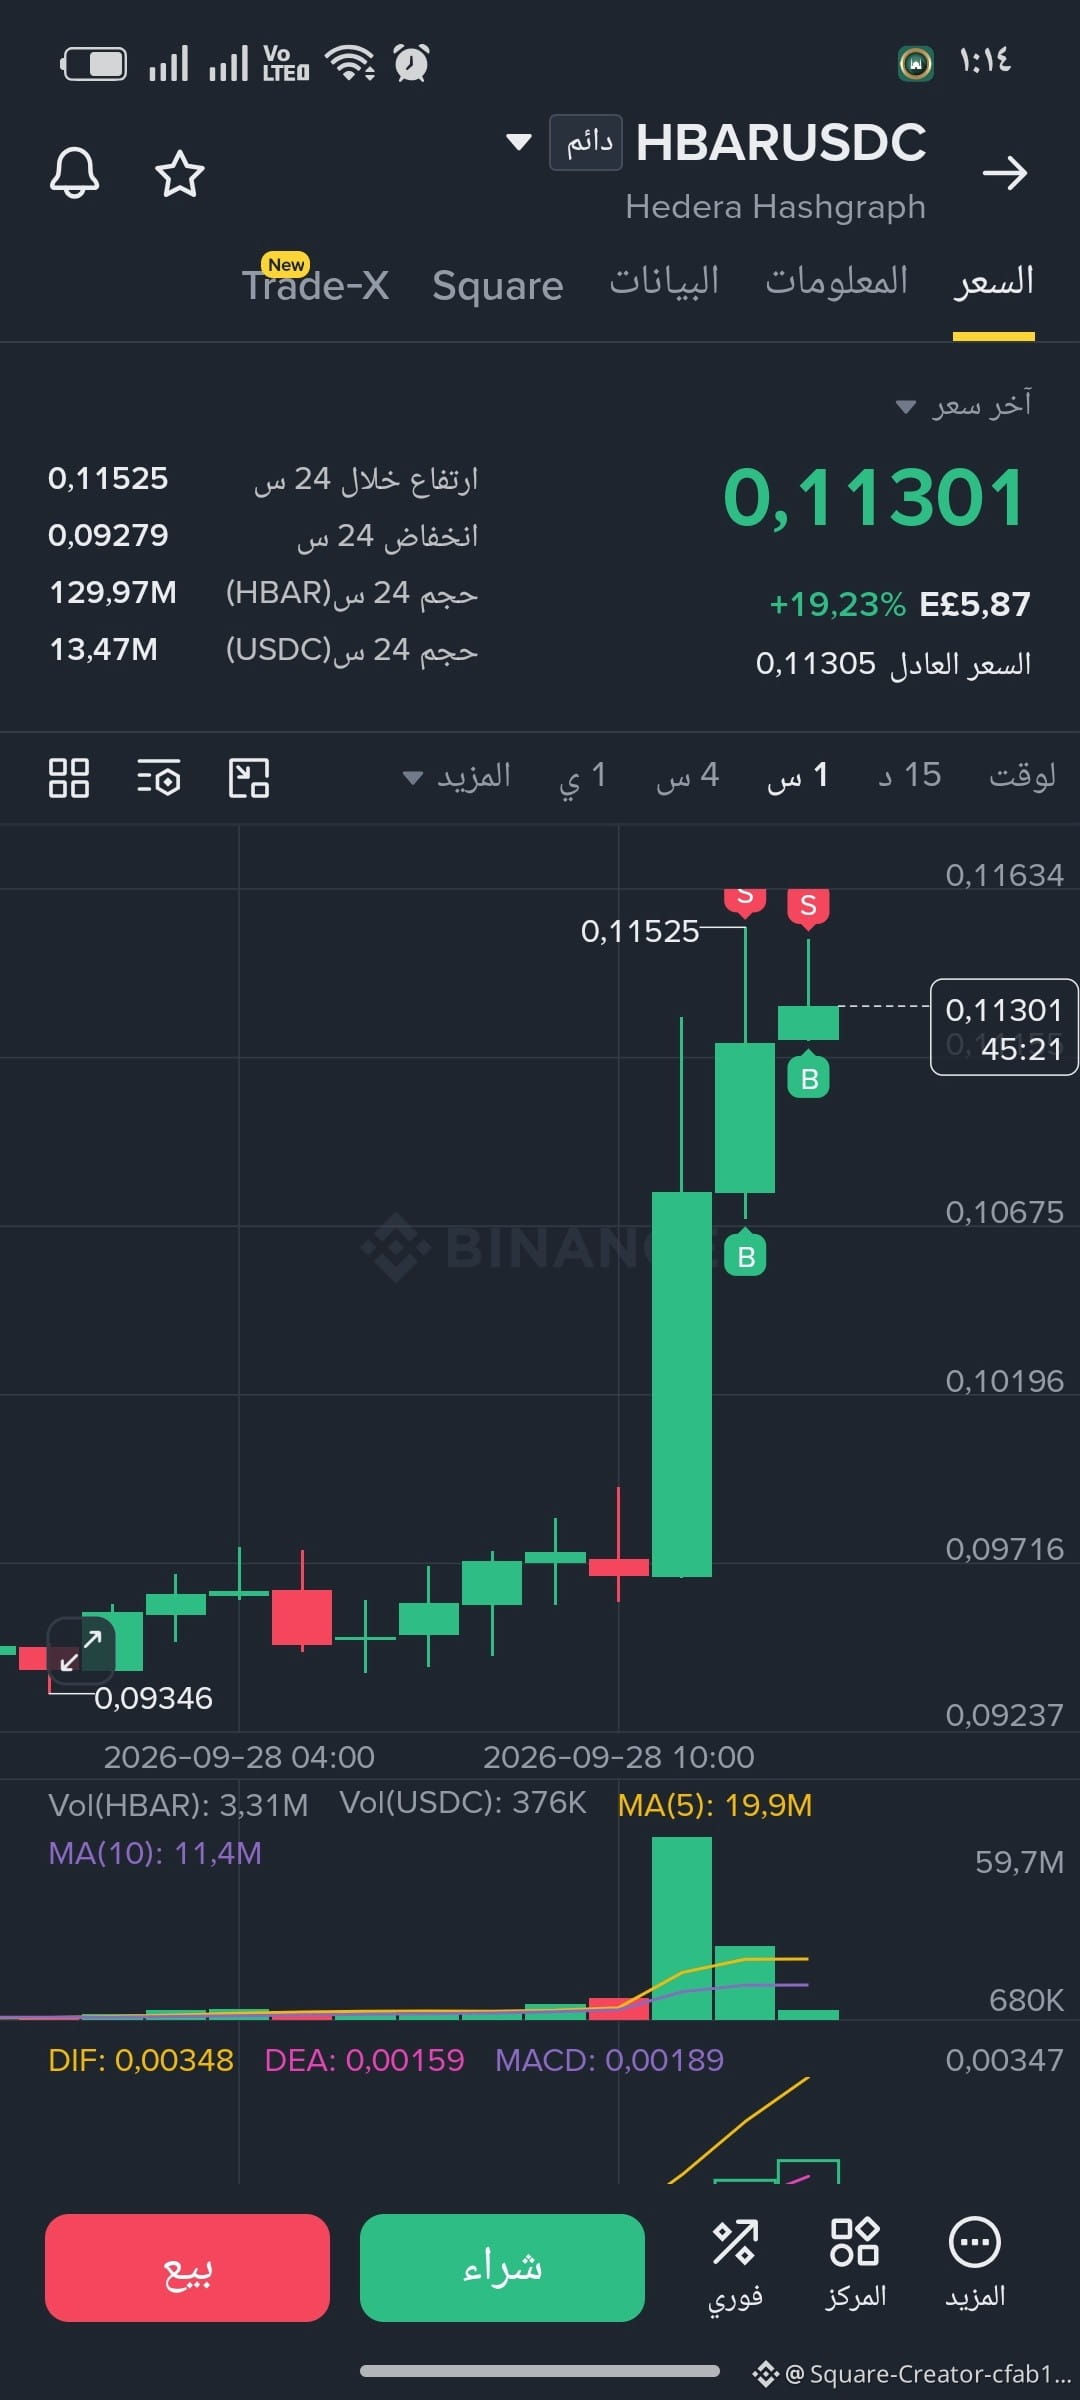
🔴 Resistance 1: 0.11525
🔴 Resistance 2: 0.11634
🟢 Support 1: ~0.11000
🟢 Support 2: 0.10675
🟢 Support 3: 0.10196
🟢 Strong support: 0.09716
🔥 Chart reading
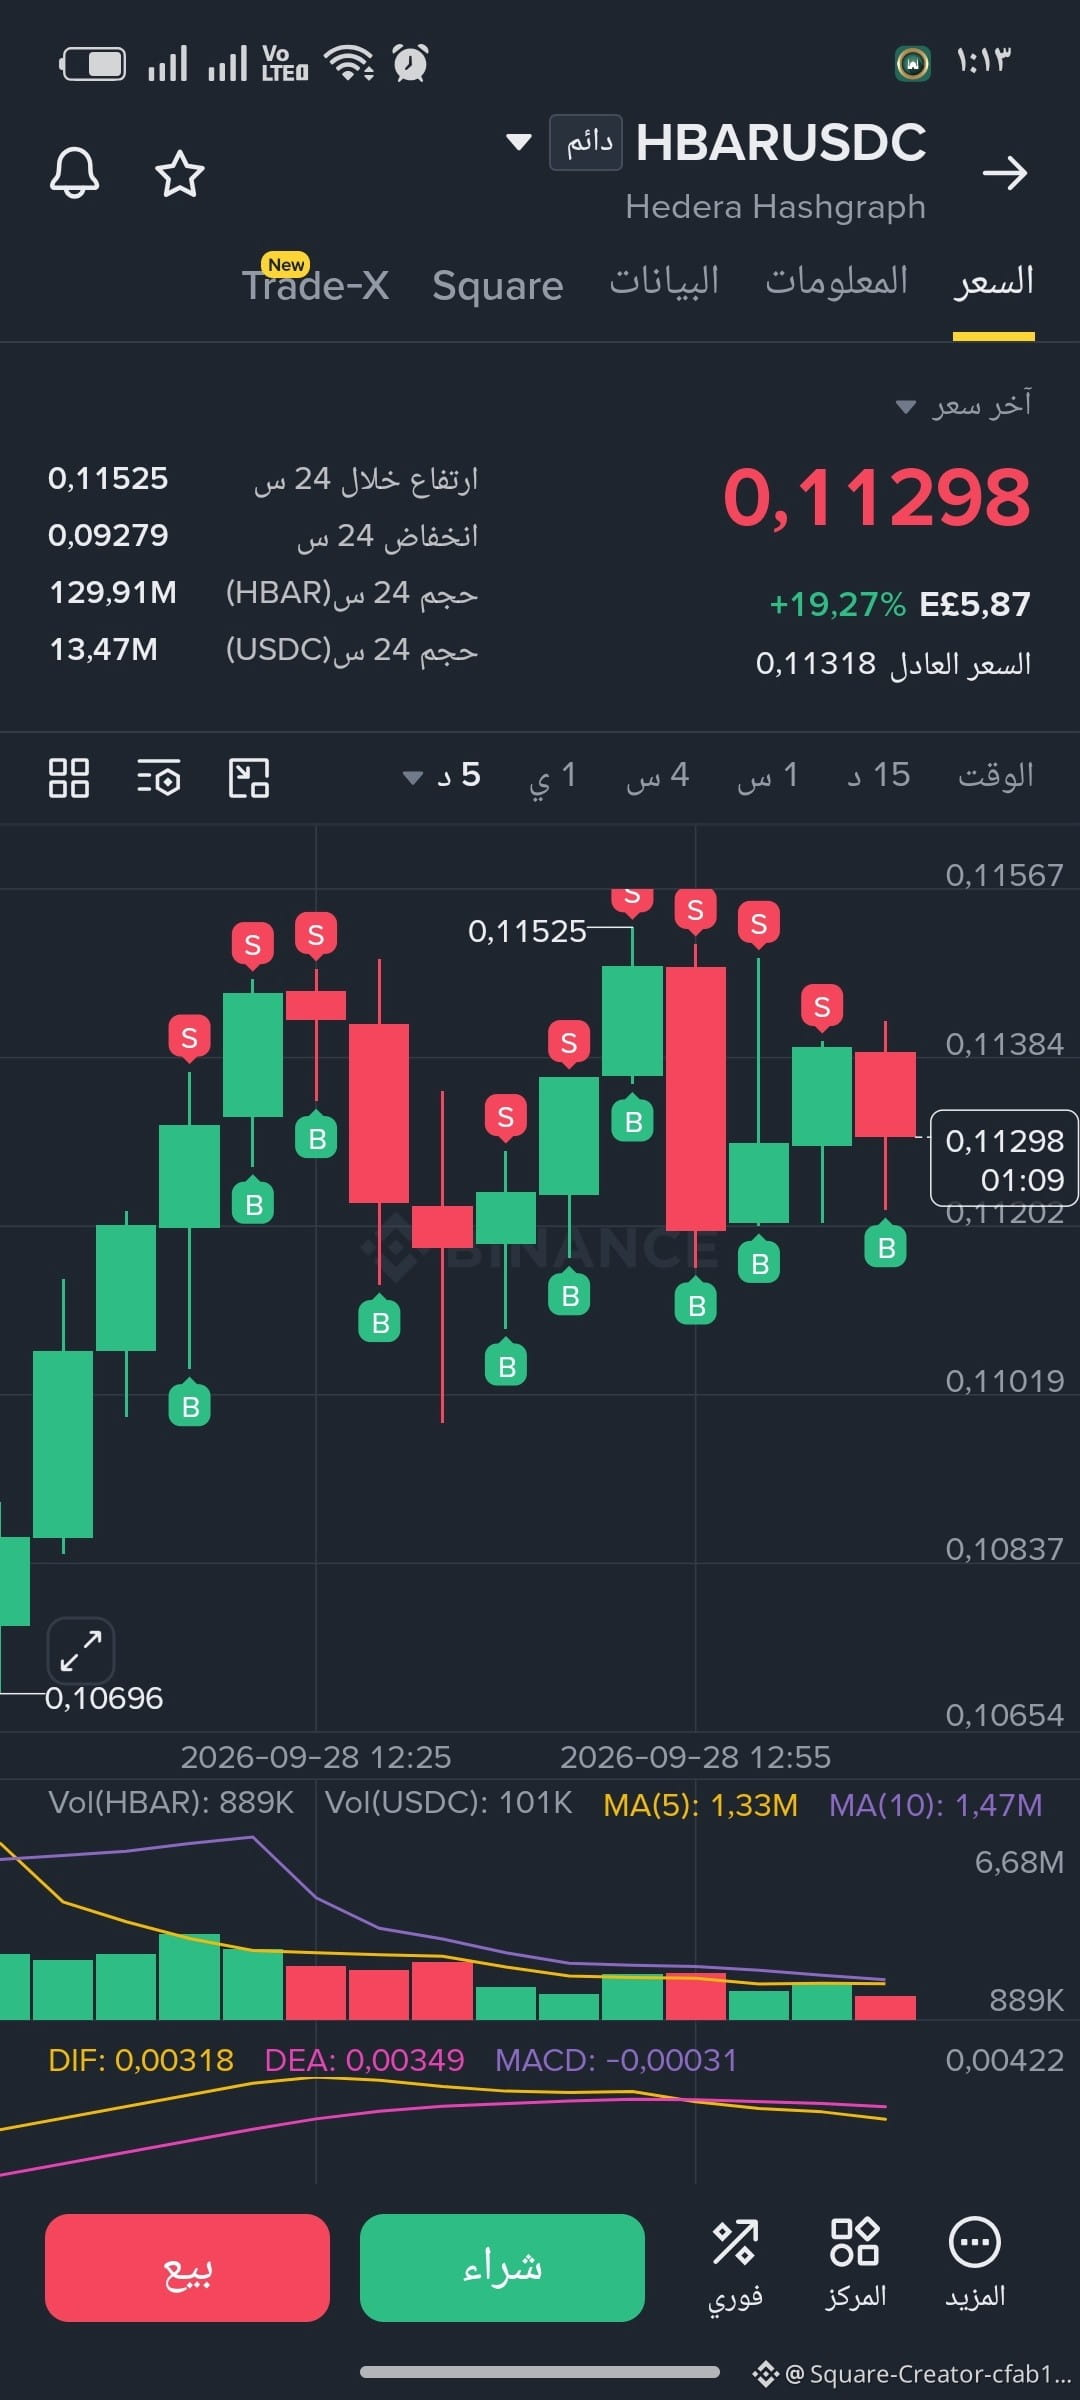
The price is at 0.11301 after a very strong rise, with a clear increase in trading volume and a positive MACD. However, the price is near the 0.11525–0.11634 resistance zone, which is an important resistance area—so chasing a buy now carries higher risk.
🟢 Conditional buy scenario
Entry: After breaking and holding above 0.11525
🎯 Target 1: 0.11634
🎯 Target 2: ~0.11900
🛑 Stop loss: Below ~0.11250
🔴 Conditional sell scenario
If the price fails to break through 0.11525–0.11634 and a bearish reversal candle appears:
🔻 Sell entry: 0.1145–0.1152 after bearish confirmation
🎯 Target 1: 0.1100
🎯 Target 2: 0.10675
🛑 Stop loss: Above 0.1165
Most important: I don’t consider reaching the resistance level alone as a sell signal; we need confirmation from the next candle. The chart shows a strong uptrend, so selling against the trend needs stronger confirmation.#FedProposesPaymentStablecoinRules #ChinaMayLetAlibabaByteDanceBuyNvidiaChips $AAPLB
Buy and sell deal 🚨🔥🚨🚩
📊 Support and resistance levels
🔴 Resistance 1: 0.11525
🔴 Resistance 2: 0.11634
🟢 Support 1: ~0.11000
🟢 Support 2: 0.10675
🟢 Support 3: 0.10196
🟢 Strong support: 0.09716
🔥 Chart reading
The price is at 0.11301 after a very strong rise, with a clear increase in trading volume and a positive MACD. However, the price is near the 0.11525–0.11634 resistance zone, which is an important resistance area—so chasing a buy now carries higher risk.
🟢 Conditional buy scenario
Entry: After breaking and holding above 0.11525
🎯 Target 1: 0.11634
🎯 Target 2: ~0.11900
🛑 Stop loss: Below ~0.11250
🔴 Conditional sell scenario
If the price fails to break through 0.11525–0.11634 and a bearish reversal candle appears:
🔻 Sell entry: 0.1145–0.1152 after bearish confirmation
🎯 Target 1: 0.1100
🎯 Target 2: 0.10675
🛑 Stop loss: Above 0.1165
Most important: I don’t consider reaching the resistance level alone as a sell signal; we need confirmation from the next candle. The chart shows a strong uptrend, so selling against the trend needs stronger confirmation.#FedProposesPaymentStablecoinRules #ChinaMayLetAlibabaByteDanceBuyNvidiaChips $AAPLB