【 $BTC four-year cycle series 80】
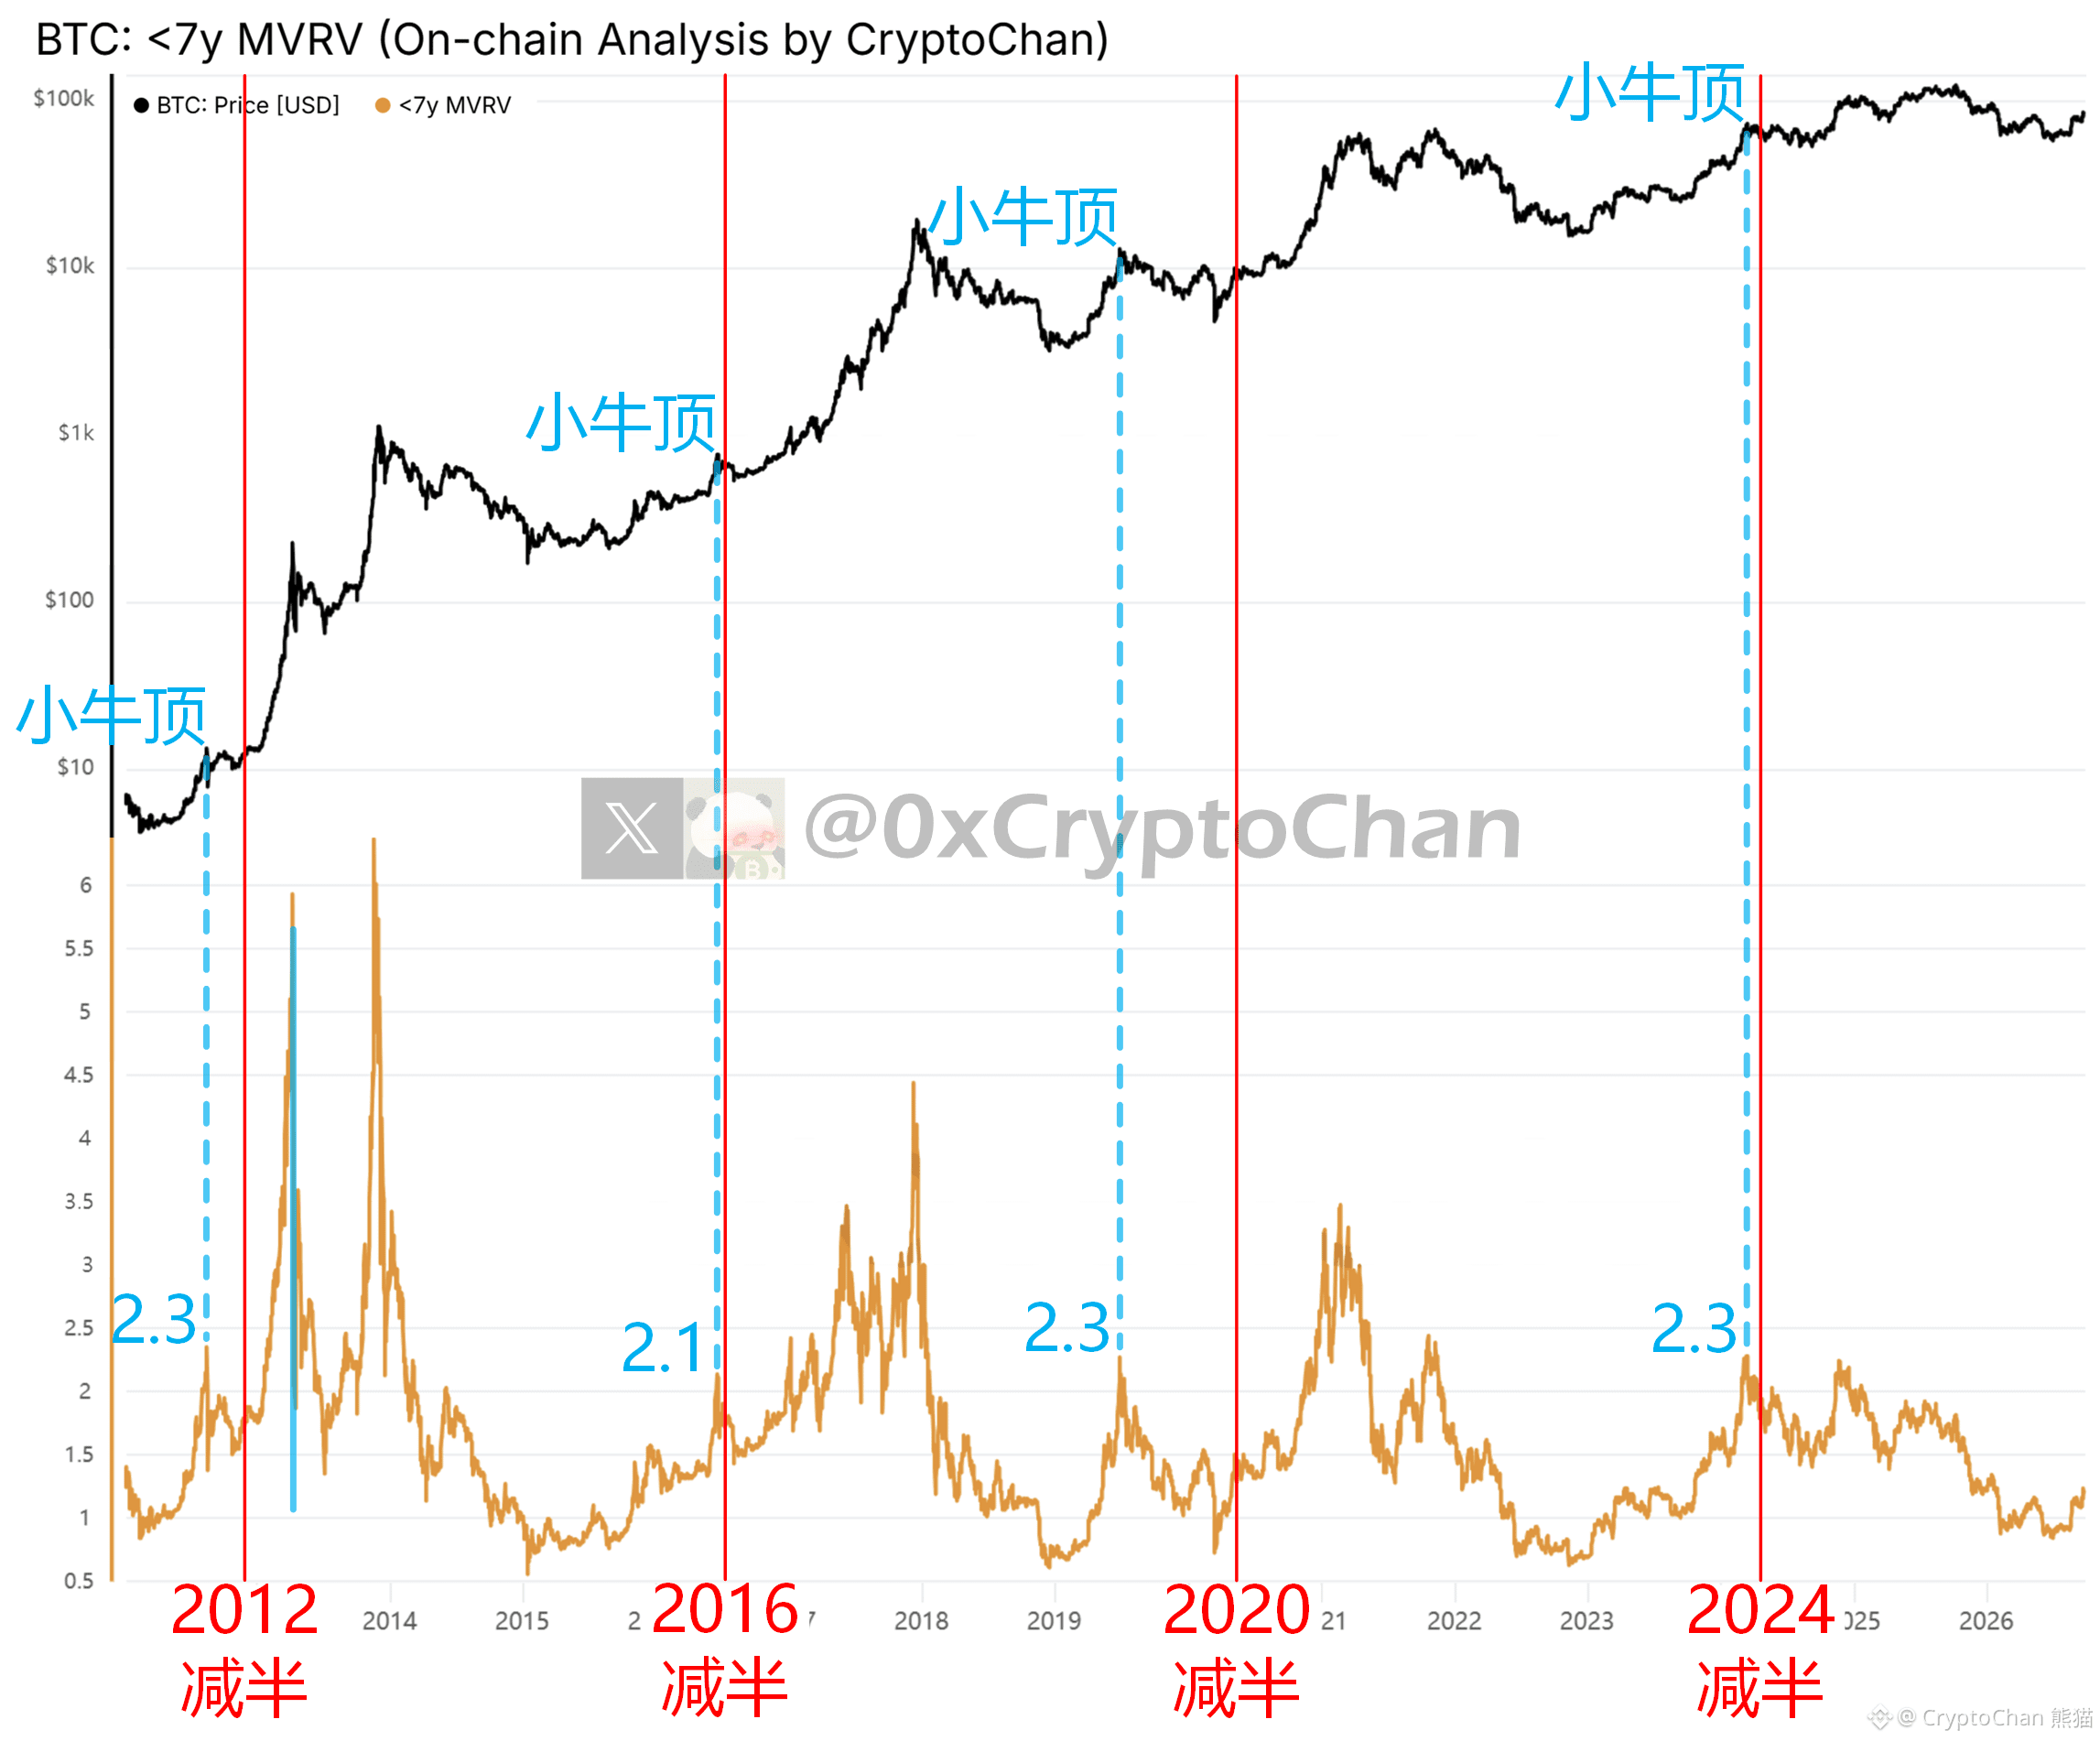
Before the 2012 halving: the orange line peaked at 2.3 (corresponding to the bull market top)
Before the 2016 halving: the orange line peaked at 2.1 (corresponding to the bull market top)
Before the 2020 halving: the orange line peaked at 2.3 (corresponding to the bull market top)
Before the 2024 halving: the orange line peaked at 2.3 (corresponding to the bull market top)
┌── 🐼 On-chain data details ──┐
Black line: Bitcoin price
Orange line: Bitcoin MVRV (excluding >7-year unmoved BTC)
Before the 2012 halving: the orange line peaked at 2.3 (corresponding to the bull market top)
Before the 2016 halving: the orange line peaked at 2.1 (corresponding to the bull market top)
Before the 2020 halving: the orange line peaked at 2.3 (corresponding to the bull market top)
Before the 2024 halving: the orange line peaked at 2.3 (corresponding to the bull market top)
┌── 🐼 On-chain data details ──┐
Black line: Bitcoin price
Orange line: Bitcoin MVRV (excluding >7-year unmoved BTC)