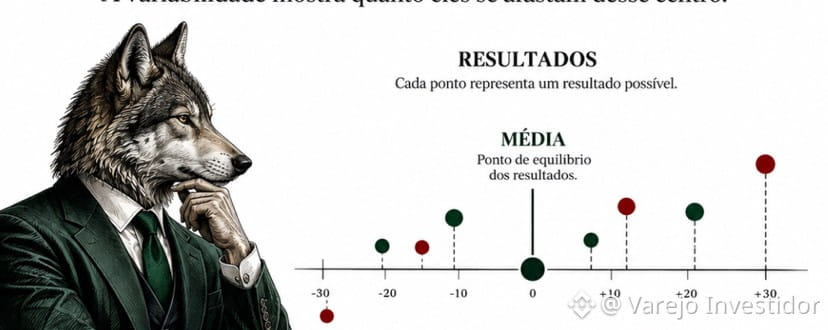

The mean helps find the central point of a set of results. But looking at it alone can hide an important piece of information: how far the results are from that center.

Imagine two investments with the same average return. One has results that are close to each other. The other alternates between very different results. Even with similar averages, the investor’s experience can be quite different.
This difference is called variability or dispersion. The greater the deviation of the results from the mean, the greater the oscillation observed tends to be.
In practice, this helps explain why two assets with similar average returns may require different behaviors.
The analysis should not look only at “how much they earned.” It’s also important to observe how the results unfolded along the way.
RESULTS → AVERAGE → DISTANCE FROM THE AVERAGE → VARIABILITY → RISK
Understanding this relationship helps the investor analyze a series of results better and avoid decisions based only on an average.
Explore the related assets below and track how these assets evolve in the market.