

SabTheTrader
441 Posts

SabTheTrader
👩💻4 Years NQ & Crypto Female Trader | X: SabTheTrader | Price action has the final say | 币安现货合约8折邀请码: SAB111
Frequent Trader
6.5 Years
143 Following
9.4K+ Followers
1.5K+ Liked
Posts
All
Quotes
Videos



帮帮Bonnie
·
--
March forward with solitary courage, view gains and losses calmly.
March forward with solitary courage, view gains and losses calmly.
#Circle与Tether冻结Bitget黑客钱包
March forward with solitary courage, view gains and losses calmly.
#Circle与Tether冻结Bitget黑客钱包


大鹤1688
·
--
To be honest, I watched it when I was little, but I forgot. Today is basically like the first time I’m watching it, haha...#1688
$AAPLB
$AAPLB


Shahzad mugheera
·
--
6+8=14


Fabi_4043
·
--
Be wise and persistent 🥰🎁
Like and follow 🎁🎁
$BNB
#BitgetHackerMoves$83MStolenXRP
Like and follow 🎁🎁
$BNB
#BitgetHackerMoves$83MStolenXRP


周周1688
·
--
Good morning
$FIL
The morning light is just right, full of energy
Do your best to be yourself, and move forward slowly. May you not live up to time, and may time not live up to you 💪
#1688家族family
$FIL
The morning light is just right, full of energy
Do your best to be yourself, and move forward slowly. May you not live up to time, and may time not live up to you 💪
#1688家族family


Shaheen 69
·
--
LearnWithShaheen69
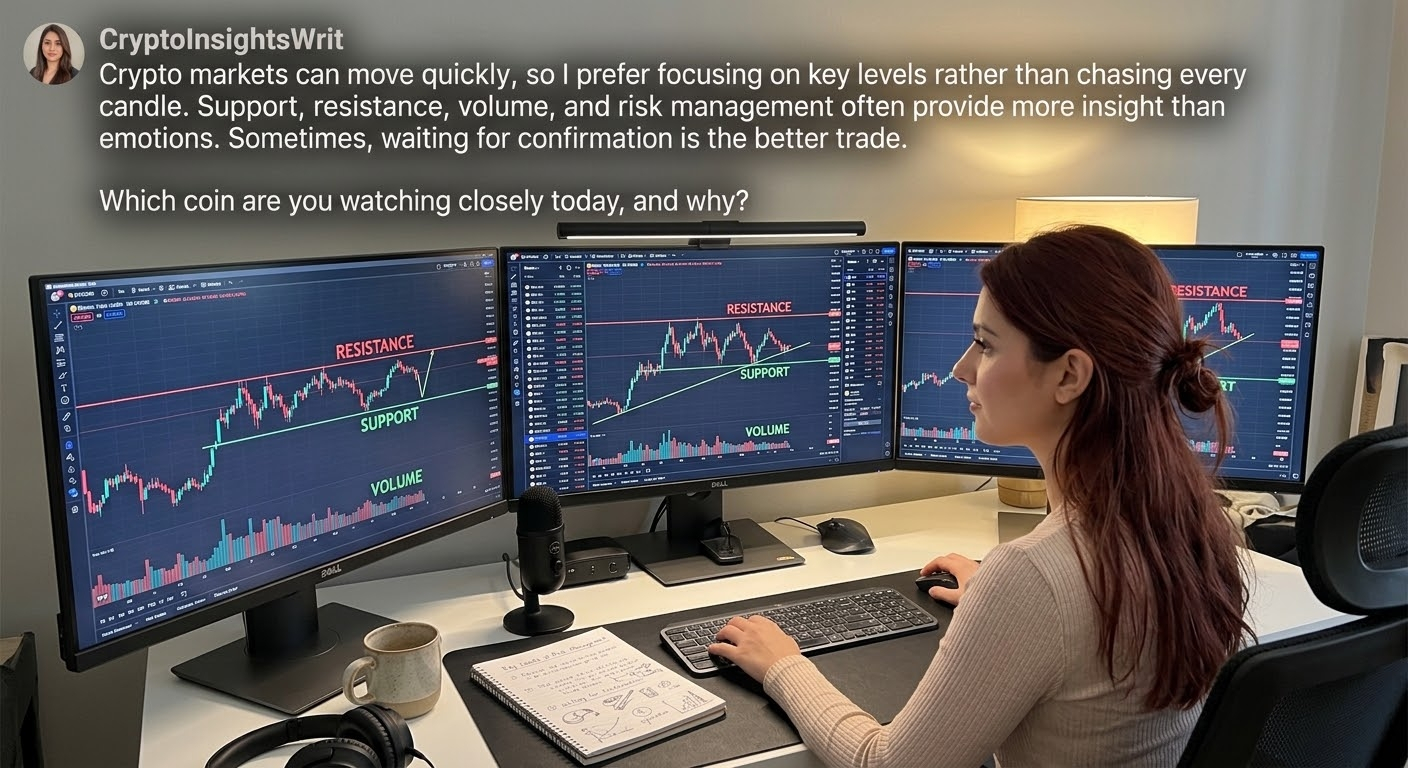
Crypto markets can move quickly, so I prefer focusing on key levels rather than chasing every candle. Support, resistance, volume, and risk management often provide more insight than emotions. Sometimes, waiting for confirmation is the better trade.
Which coin are you watching closely today, and why?
Crypto markets can move quickly, so I prefer focusing on key levels rather than chasing every candle. Support, resistance, volume, and risk management often provide more insight than emotions. Sometimes, waiting for confirmation is the better trade.
Which coin are you watching closely today, and why?

分析师尤斯1688
·
--
comment to get your bonus.


橙子Joyce
·
--
✨Orange Joyce|Live Stream Announcement✨
⏰ Time: 21:00–23:00 on September 28, 2026
⏰ Going forward, daily live stream time will be 21:00–23:00
📌 Theme: Analysis of US stock investment strategies and trading practices
Highlights:
✅ Underlying logic of the US stock market and judging market style
✅ Comparison of different strategies: value investing, growth stocks, swing trading
✅ Practical ideas for position management, take-profit and stop-loss
✅ Key points and warnings for US trading risks
Welcome everyone to the live room to chat and discuss!
Hello everyone, welcome to stream.
Today’s topic: US stock investment strategy analysis and trading practice.
We’ll discuss popular strategies, position management and risk control.
⏰ Time: 21:00–23:00 on September 28, 2026
⏰ Going forward, daily live stream time will be 21:00–23:00
📌 Theme: Analysis of US stock investment strategies and trading practices
Highlights:
✅ Underlying logic of the US stock market and judging market style
✅ Comparison of different strategies: value investing, growth stocks, swing trading
✅ Practical ideas for position management, take-profit and stop-loss
✅ Key points and warnings for US trading risks
Welcome everyone to the live room to chat and discuss!
Hello everyone, welcome to stream.
Today’s topic: US stock investment strategy analysis and trading practice.
We’ll discuss popular strategies, position management and risk control.


MAYA_
·
--
$BTC 90k coming soon 🟢
GIFT BOX 🎁🎁🎁
GIFT BOX 🎁🎁🎁


Syco 疯子
·
--
✨ GOOD EVENING TO YOU ALL✨
I hope you had a beautiful sunny day.
I wish you a sweet evening anda cosmic night.
Kindly ✨
@Syco 疯子 🌹
$BNB
I hope you had a beautiful sunny day.
I wish you a sweet evening anda cosmic night.
Kindly ✨
@Syco 疯子 🌹
$BNB


KSHFI_X
·
--
Alhamdulillah! 💛🎉
I finally reached 10K followers on Binance Square! 🥹
Thank you to everyone who followed and supported me throughout this journey.
10K achieved Alhamdulillah. ❤️
Now, onto the next milestone! 🚀
I finally reached 10K followers on Binance Square! 🥹
Thank you to everyone who followed and supported me throughout this journey.
10K achieved Alhamdulillah. ❤️
Now, onto the next milestone! 🚀


king Gulfam
·
--
#Binancefutuuretrading
@CXMT_@AAVE_@龙虾/USDT
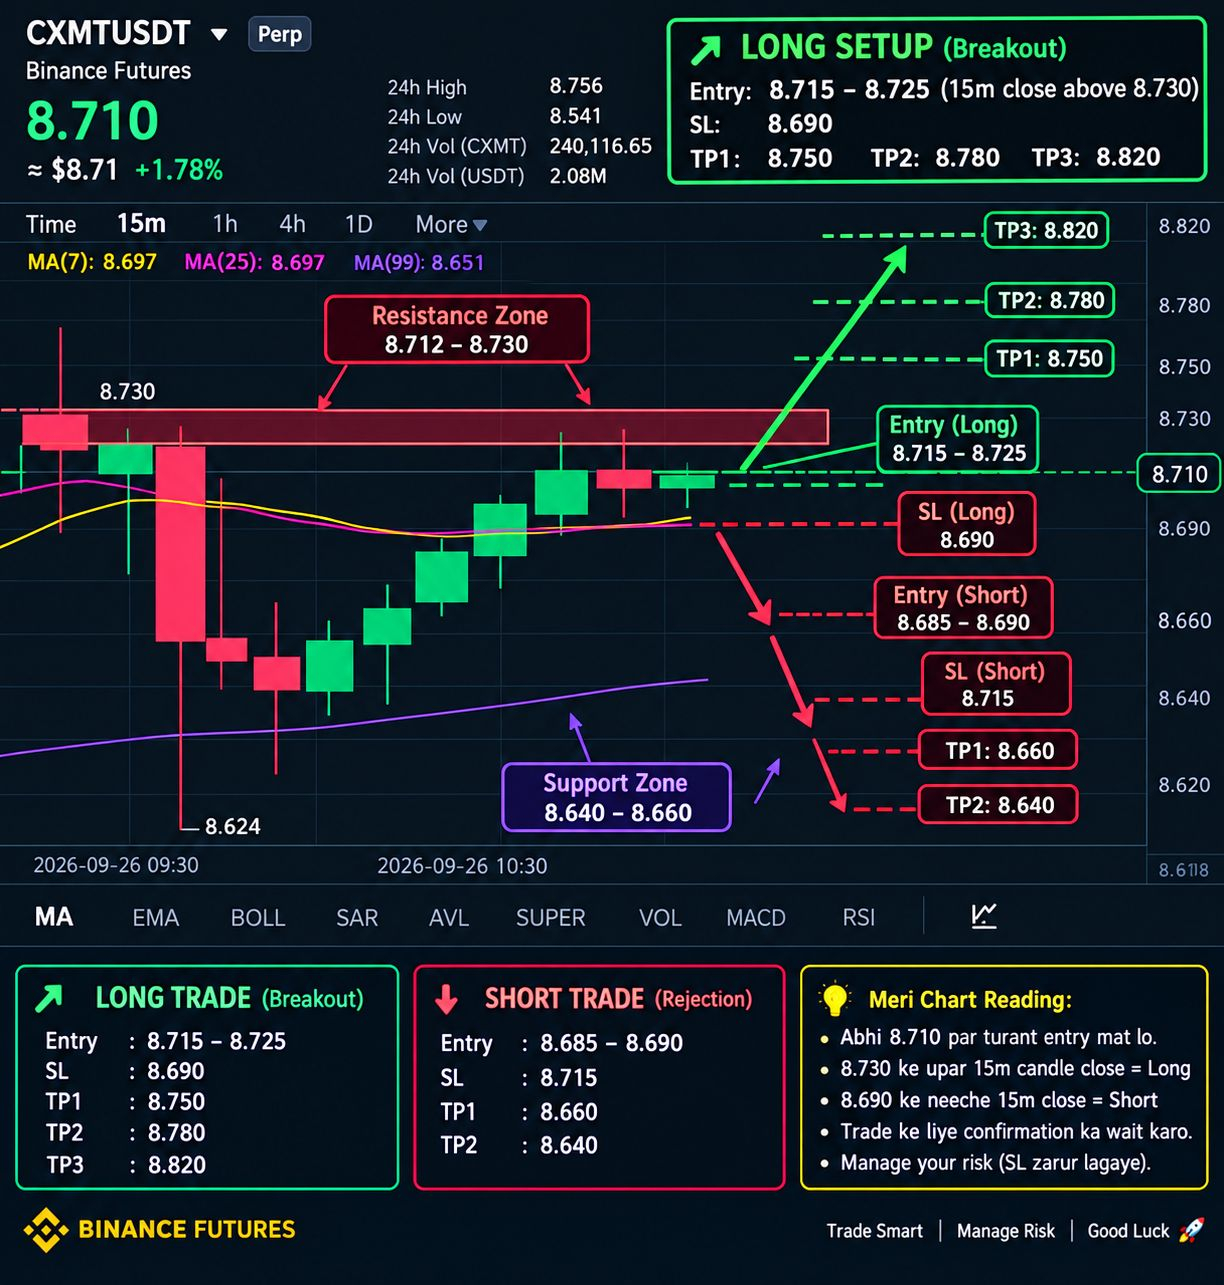
$CXMT
📈 LONG setup — after confirmation
Entry: above 8.715–8.725 with a 15m candle close
SL: 8.690
TP1: 8.750
TP2: 8.780
TP3: 8.820
📉 SHORT setup — if resistance rejects
If strong rejection comes from 8.712–8.730 and price closes below 8.690 on a 15m timeframe:
Entry: 8.685–8.690
SL: 8.715
TP1: 8.660
TP2: 8.640
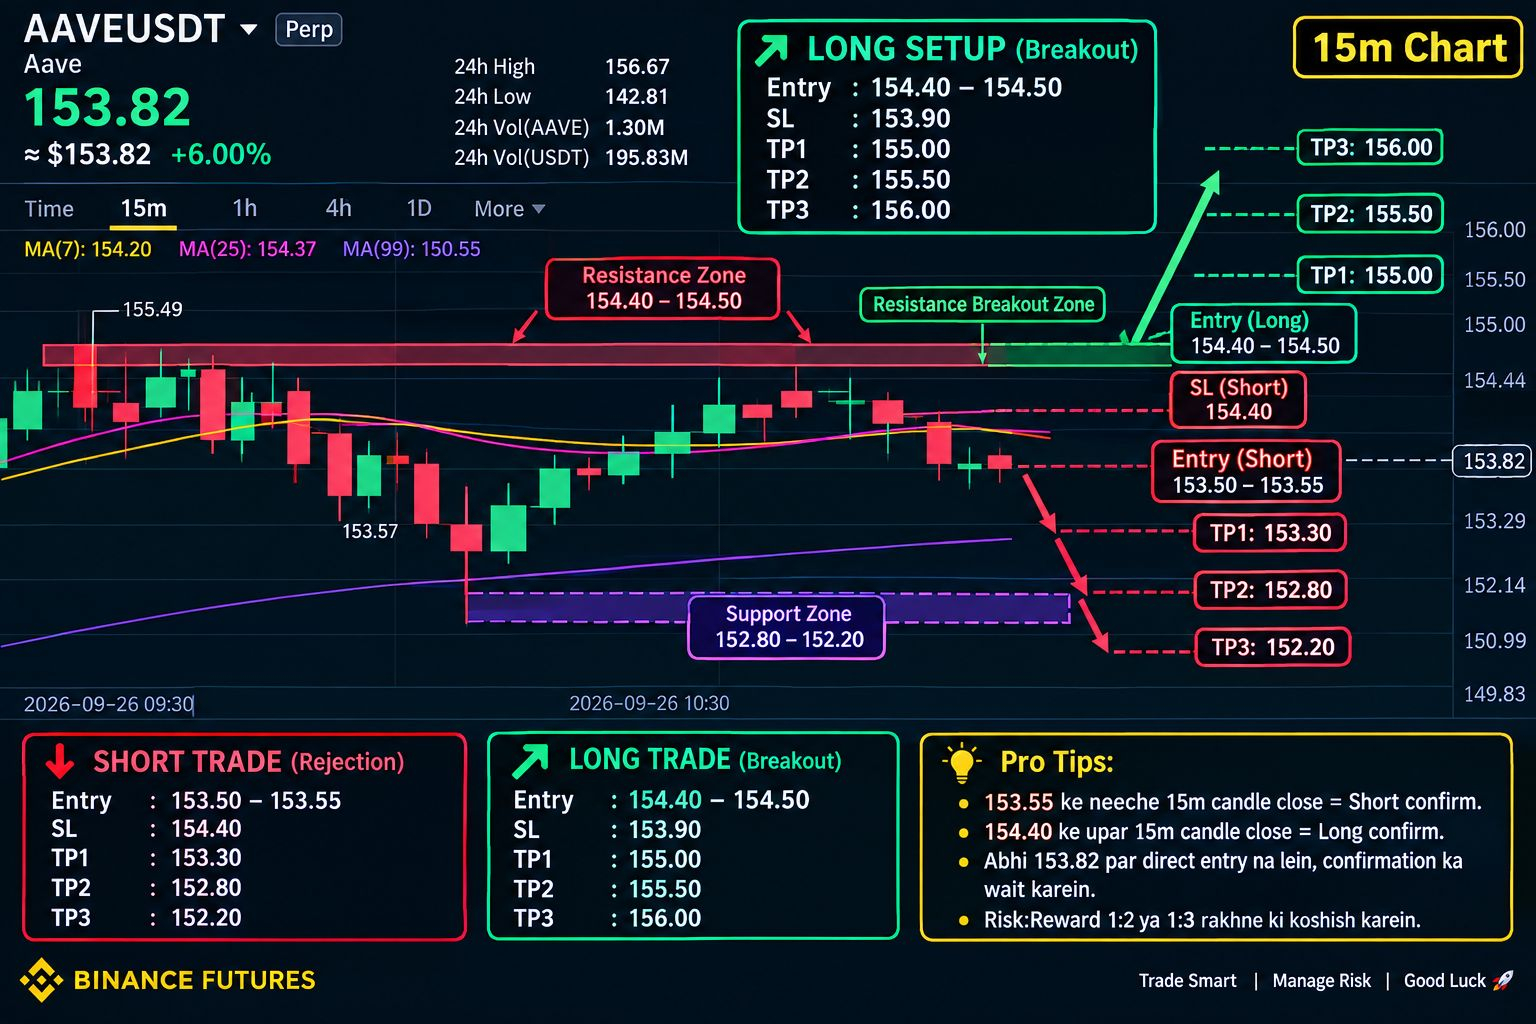
$AAVE
📉 SHORT setup
If a 15m candle closes below 153.55, then:
Entry: 153.50–153.55
SL: 154.40
TP1: 153.30
TP2: 152.80
TP3: 152.20
📈 LONG setup
For the long, first get confirmation of a 15m candle close above 154.40:
Entry: 154.40–154.50
SL: 153.90
TP1: 155.00
TP2: 155.50
TP3: 156.00
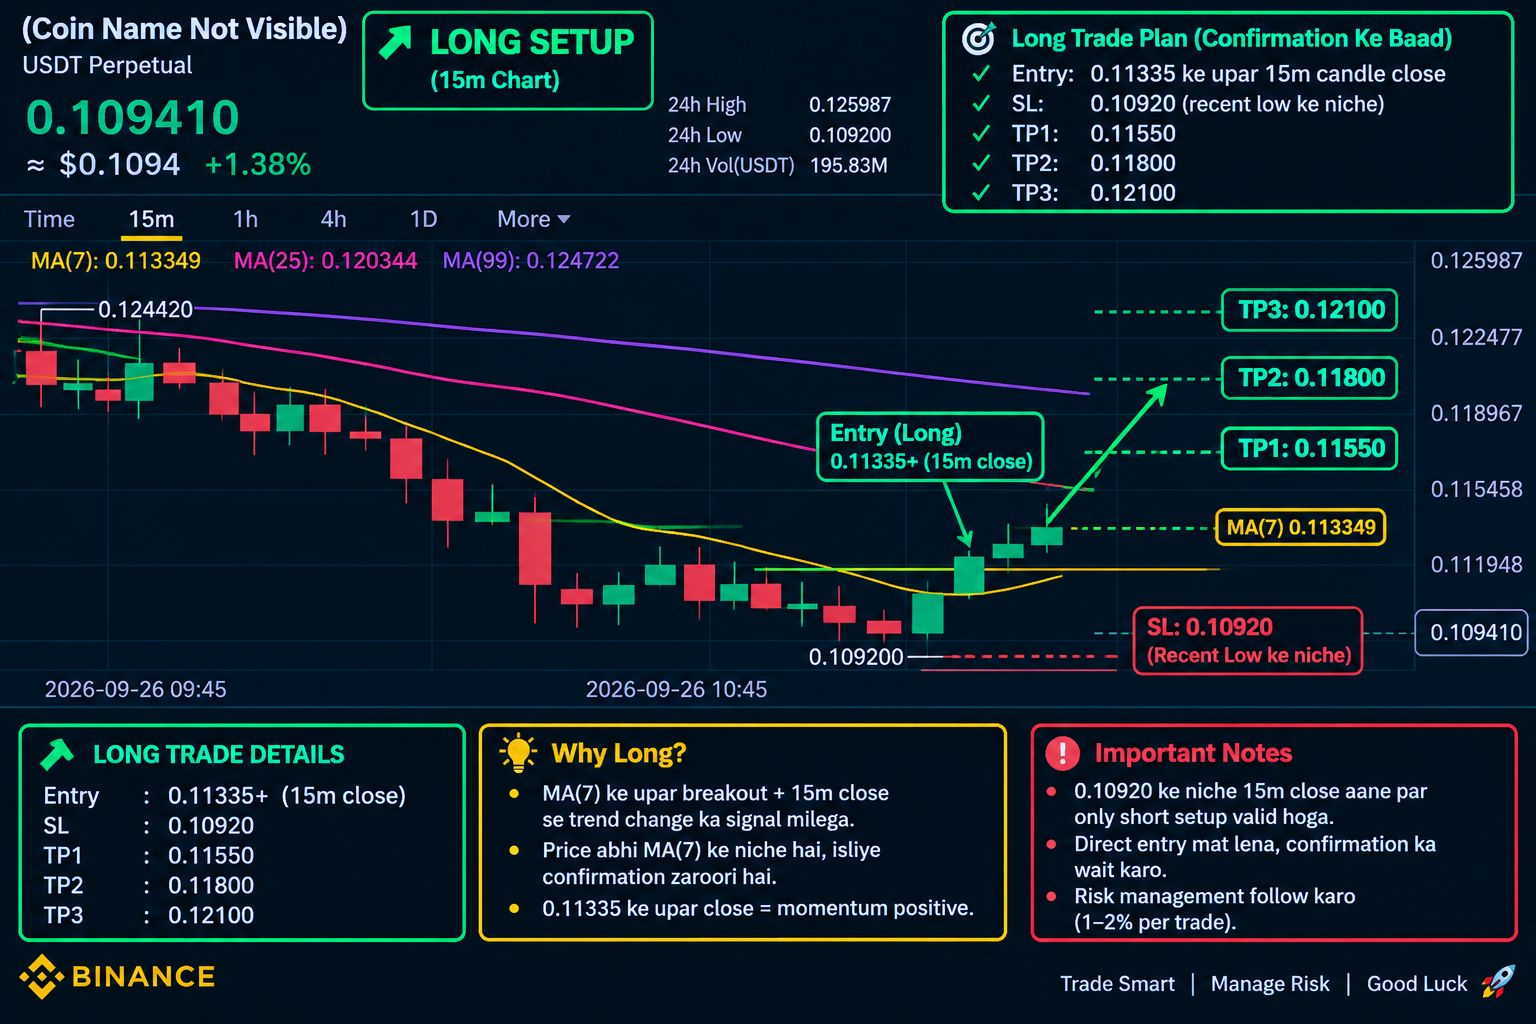
$龙虾
📈 LONG SETUP — 15M Chart
Current Price: 0.109410
Long Entry: after a 15-minute candle close above 0.11335
Stop Loss (SL): 0.10920
TP1: 0.11550
TP2: 0.11800
TP3: 0.12100
📉 SHORT setup — after confirmation
If a 15m candle closes below 0.10920, then:
Entry: 0.1090–0.1092
SL: 0.1120
TP1: 0.1070
TP2: 0.1050
TP3: 0.1025
👉🏻 YOU CAN TRY IT'S 🤞🏻
@CXMT_@AAVE_@龙虾/USDT
$CXMT
📈 LONG setup — after confirmation
Entry: above 8.715–8.725 with a 15m candle close
SL: 8.690
TP1: 8.750
TP2: 8.780
TP3: 8.820
📉 SHORT setup — if resistance rejects
If strong rejection comes from 8.712–8.730 and price closes below 8.690 on a 15m timeframe:
Entry: 8.685–8.690
SL: 8.715
TP1: 8.660
TP2: 8.640
$AAVE
📉 SHORT setup
If a 15m candle closes below 153.55, then:
Entry: 153.50–153.55
SL: 154.40
TP1: 153.30
TP2: 152.80
TP3: 152.20
📈 LONG setup
For the long, first get confirmation of a 15m candle close above 154.40:
Entry: 154.40–154.50
SL: 153.90
TP1: 155.00
TP2: 155.50
TP3: 156.00
$龙虾
📈 LONG SETUP — 15M Chart
Current Price: 0.109410
Long Entry: after a 15-minute candle close above 0.11335
Stop Loss (SL): 0.10920
TP1: 0.11550
TP2: 0.11800
TP3: 0.12100
📉 SHORT setup — after confirmation
If a 15m candle closes below 0.10920, then:
Entry: 0.1090–0.1092
SL: 0.1120
TP1: 0.1070
TP2: 0.1050
TP3: 0.1025
👉🏻 YOU CAN TRY IT'S 🤞🏻
灼见Cryptosighted
·
--
Bullish🚨 BNB is quietly strengthening again.
But this time, what’s really worth looking at is not just the price chart.
After BNB Chain recently completed a capacity expansion upgrade, the mainnet’s processing capabilities have continued to improve. In other words, while the price is strengthening, the underlying network is also expanding.
⚡ Network capacity keeps improving
🔥 On-chain activity stays strong
💰 DeFi, trading, and payment demand continues
🤖 New use cases are expanding, such as AI agents and RWA
This creates an interesting logic for BNB:
When BTC enters a period of consolidation, capital may start looking again for assets with real usage and ecosystem support.
What’s truly worth watching isn’t how much BNB is up today, but—
Whether the growth of BNB Chain can continue to translate into value for BNB.
If it can, this won’t be just a simple catch-up rally.
🟢 Ecosystem revaluation
🔴 Short-term rotation
#BTC #ETH #BNB
But this time, what’s really worth looking at is not just the price chart.
After BNB Chain recently completed a capacity expansion upgrade, the mainnet’s processing capabilities have continued to improve. In other words, while the price is strengthening, the underlying network is also expanding.
⚡ Network capacity keeps improving
🔥 On-chain activity stays strong
💰 DeFi, trading, and payment demand continues
🤖 New use cases are expanding, such as AI agents and RWA
This creates an interesting logic for BNB:
When BTC enters a period of consolidation, capital may start looking again for assets with real usage and ecosystem support.
What’s truly worth watching isn’t how much BNB is up today, but—
Whether the growth of BNB Chain can continue to translate into value for BNB.
If it can, this won’t be just a simple catch-up rally.
🟢 Ecosystem revaluation
🔴 Short-term rotation
#BTC #ETH #BNB


奕泽YIZZE
·
--
🧧🔥 In the tide of numbers, consensus is faith. When countless individuals’ tiny lights come together, they illuminate the unknown future. Explore the source of value and seek a resonance of the spirit. LUCiC🚀🚀🚀
Please follow, like, and share Thanks!
Please follow, like, and share Thanks!


长得帅不如跑的快1688
·
--
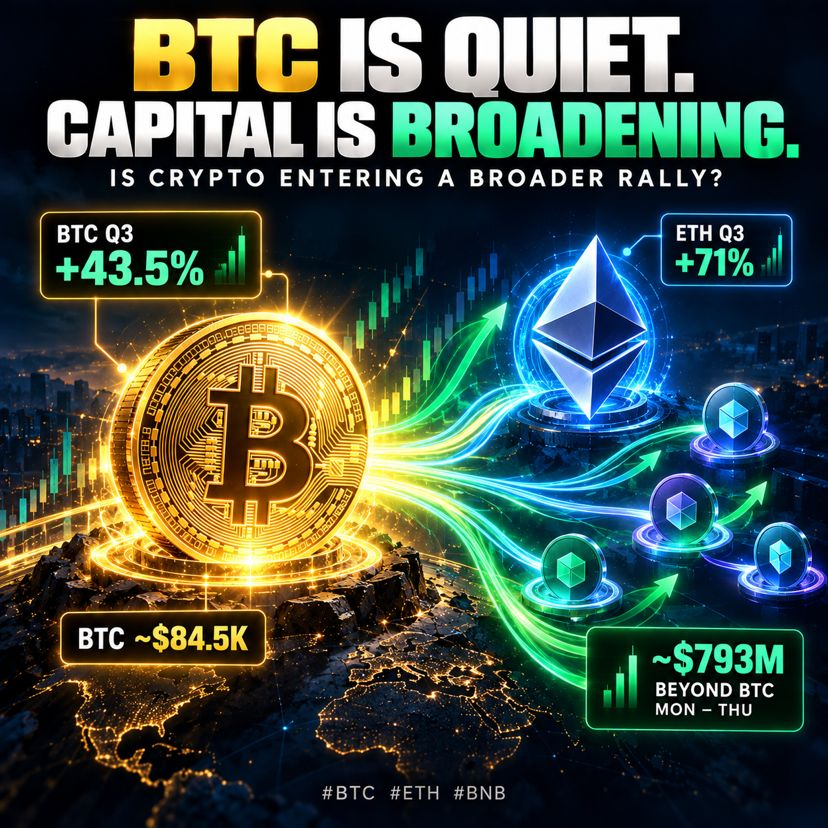
🚨 BTC IS QUIET.
But capital isn’t.
Bitcoin is still consolidating around $84K–$85K.
Yet something interesting is happening underneath the market:
CAPITAL IS BROADENING BEYOND BTC.
Q3 so far:
₿ BTC → ~+43.5%
Ξ ETH → ~+71%
And from Monday through Thursday:
💰 U.S. crypto ETF inflows → ~$3.04B
₿ Bitcoin → ~$2.25B
🔥 Beyond BTC → ~$793M
Ξ Ethereum → ~$603M
So here’s the real question:
IS CAPITAL ROTATING BEYOND BITCOIN?
In most crypto rallies,
money enters BTC first.
But the next stage matters more:
Does capital start spreading into ETH
and the broader crypto market?
Especially while:
📈 U.S. 10Y Treasury yields remain at 5.17%.
If that rotation continues despite high yields,
the market may be telling us something bigger.
Now I’m watching:
₿ BTC holding $84K
Ξ ETH relative strength
💰 Non-BTC ETF flows
🔥 Whether capital keeps broadening
👇 Your take?
ROTATION IS STARTING 🟢
or
BTC TAKES LIQUIDITY BACK 🔴?
#BTC #ETH #BNB
But capital isn’t.
Bitcoin is still consolidating around $84K–$85K.
Yet something interesting is happening underneath the market:
CAPITAL IS BROADENING BEYOND BTC.
Q3 so far:
₿ BTC → ~+43.5%
Ξ ETH → ~+71%
And from Monday through Thursday:
💰 U.S. crypto ETF inflows → ~$3.04B
₿ Bitcoin → ~$2.25B
🔥 Beyond BTC → ~$793M
Ξ Ethereum → ~$603M
So here’s the real question:
IS CAPITAL ROTATING BEYOND BITCOIN?
In most crypto rallies,
money enters BTC first.
But the next stage matters more:
Does capital start spreading into ETH
and the broader crypto market?
Especially while:
📈 U.S. 10Y Treasury yields remain at 5.17%.
If that rotation continues despite high yields,
the market may be telling us something bigger.
Now I’m watching:
₿ BTC holding $84K
Ξ ETH relative strength
💰 Non-BTC ETF flows
🔥 Whether capital keeps broadening
👇 Your take?
ROTATION IS STARTING 🟢
or
BTC TAKES LIQUIDITY BACK 🔴?
#BTC #ETH #BNB
周周1688
·
--
[Ended] 🎙️ DCA BNB, mimi special AMA!
11.9k listens

CJ_GraceWang1688
·
--
10u
🎁🎁🎁
$DOGE
#狗狗币ETF创上市来最大周流入
Can Dogecoin hold steady at 0.1 next week?
🎁🎁🎁
$DOGE
#狗狗币ETF创上市来最大周流入
Can Dogecoin hold steady at 0.1 next week?

Mira小白桃
·
--
#SOL现货ETF周净流入1.88亿美元
Latest data shows that last week, the U.S. spot SOL ETF saw net inflows of about $188 million.
How important is this number?
It’s the second-highest single-week net inflow since the spot SOL ETF launched, only behind the roughly $199 million net inflow in its first week.
Even more noteworthy is that on September 25, the single-day net inflow reached $86.7 million, setting a new current single-day high.
That means it’s not just retail investors paying attention to SOL anymore;
institutional capital is also increasing its SOL allocation via ETFs.
So what does this mean for SOL?
I think the most important thing isn’t:
“$188 million just came in—does SOL immediately about to surge?”
Instead, it’s whether these fund flows can be sustained.
Previously, the spot SOL ETF had already maintained net inflows for multiple consecutive weeks; the cumulative net inflows have now surpassed $1.6 billion, and the ETF’s total assets have risen to more than about $1.5 billion.
This points to a change:
institutional capital channels for SOL are becoming increasingly mature.
From a trading perspective, I’d interpret this as a relatively positive signal.
Especially if, now, you see:
ETF inflows continuing + on-chain activity staying active + SOL’s price breaking through resistance in tandem
Once these three start to resonate together, SOL’s upward trend is more likely to continue.
But conversely, if ETF inflows keep coming in while the price keeps failing to break higher,
then you need to be careful:
funds are entering, but there’s also heavy sell pressure overhead.
So ETF data can’t be used to judge buy or sell on its own.
Fund flows are supportive; price structure is the confirmation.
What I’m paying more attention to for SOL right now is:
Can ETF-related capital keep maintaining inflows consecutively?
If the next one or two weeks still show relatively clear net inflows, the market will pay even more attention to whether SOL can continue challenging the prior highs.
And if the capital suddenly flips into consistent outflows,
then we’ll need to reassess whether this leg of the rally is already entering a high-level profit-taking phase.
So for today’s data, I’d define it as:
Not a signal that “SOL will take off immediately,”
but rather:
Institutional capital is once again increasing its focus on SOL.
For SOL’s medium-term capital structure, this is a change worth continuing to monitor.
Look at the money first, then look at the price.
If the money really keeps coming in, the market will have more conviction behind the move.
Latest data shows that last week, the U.S. spot SOL ETF saw net inflows of about $188 million.
How important is this number?
It’s the second-highest single-week net inflow since the spot SOL ETF launched, only behind the roughly $199 million net inflow in its first week.
Even more noteworthy is that on September 25, the single-day net inflow reached $86.7 million, setting a new current single-day high.
That means it’s not just retail investors paying attention to SOL anymore;
institutional capital is also increasing its SOL allocation via ETFs.
So what does this mean for SOL?
I think the most important thing isn’t:
“$188 million just came in—does SOL immediately about to surge?”
Instead, it’s whether these fund flows can be sustained.
Previously, the spot SOL ETF had already maintained net inflows for multiple consecutive weeks; the cumulative net inflows have now surpassed $1.6 billion, and the ETF’s total assets have risen to more than about $1.5 billion.
This points to a change:
institutional capital channels for SOL are becoming increasingly mature.
From a trading perspective, I’d interpret this as a relatively positive signal.
Especially if, now, you see:
ETF inflows continuing + on-chain activity staying active + SOL’s price breaking through resistance in tandem
Once these three start to resonate together, SOL’s upward trend is more likely to continue.
But conversely, if ETF inflows keep coming in while the price keeps failing to break higher,
then you need to be careful:
funds are entering, but there’s also heavy sell pressure overhead.
So ETF data can’t be used to judge buy or sell on its own.
Fund flows are supportive; price structure is the confirmation.
What I’m paying more attention to for SOL right now is:
Can ETF-related capital keep maintaining inflows consecutively?
If the next one or two weeks still show relatively clear net inflows, the market will pay even more attention to whether SOL can continue challenging the prior highs.
And if the capital suddenly flips into consistent outflows,
then we’ll need to reassess whether this leg of the rally is already entering a high-level profit-taking phase.
So for today’s data, I’d define it as:
Not a signal that “SOL will take off immediately,”
but rather:
Institutional capital is once again increasing its focus on SOL.
For SOL’s medium-term capital structure, this is a change worth continuing to monitor.
Look at the money first, then look at the price.
If the money really keeps coming in, the market will have more conviction behind the move.

Log in to explore more content