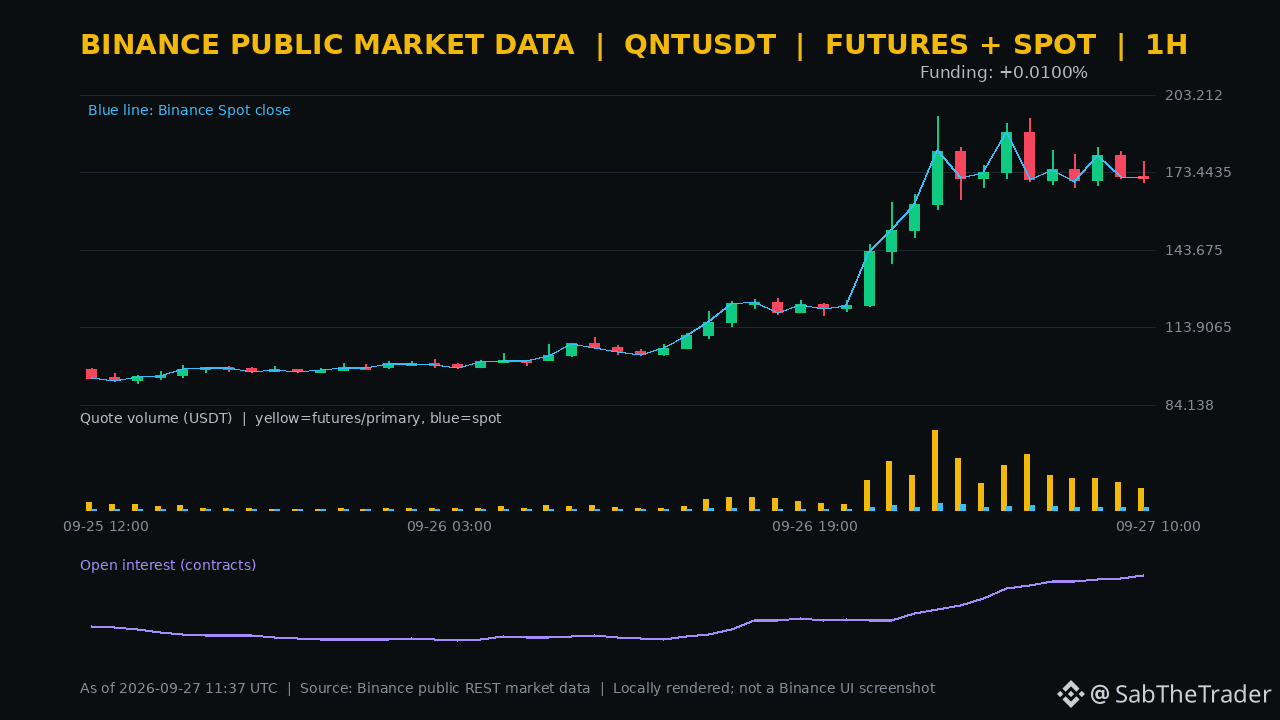
QNT’s price and positioning are beginning to move in opposite directions. According to public data from Binance at 19:37 (UTC+8), $QNT spot is quoted at 164.51, up 57.55% over the past 24 hours, while the perpetual is at 164.36, up 57.27%. Perpetual 24-hour trading volume is about 1.089 billion USDT.
In the previous full hour, the perpetuals only pulled back 0.20%, and trading volume decreased 22.85% quarter-over-quarter; however, the current price is already about 4.27% below that hour’s close of 171.69. The price retracement is deepening, yet positioning is not exiting in sync: OI (open interest) for the most recent hour increased 2.76%, and within the 30-point window the cumulative increase was 109.58%.
⚠️ The Funding indicator value and the most recent settlement are both +0.0100%. The rate is not extreme, which does not mean the risk is low. As the price retreats from the highs while OI continues to expand, this suggests new leverage is still absorbing larger two-way volatility. So you cannot simply interpret the pullback as a trend reversal, nor is it suitable to bottom-fish just because the upside momentum has narrowed.
For the short term, first watch whether price can regain the 169.50–171.69 range, accompanied by improving trading activity and a slowing in OI growth. If price continues to stay below that range while OI keeps rising, deleveraging-driven volatility may further intensify.
In the previous full hour, the perpetuals only pulled back 0.20%, and trading volume decreased 22.85% quarter-over-quarter; however, the current price is already about 4.27% below that hour’s close of 171.69. The price retracement is deepening, yet positioning is not exiting in sync: OI (open interest) for the most recent hour increased 2.76%, and within the 30-point window the cumulative increase was 109.58%.
⚠️ The Funding indicator value and the most recent settlement are both +0.0100%. The rate is not extreme, which does not mean the risk is low. As the price retreats from the highs while OI continues to expand, this suggests new leverage is still absorbing larger two-way volatility. So you cannot simply interpret the pullback as a trend reversal, nor is it suitable to bottom-fish just because the upside momentum has narrowed.
For the short term, first watch whether price can regain the 169.50–171.69 range, accompanied by improving trading activity and a slowing in OI growth. If price continues to stay below that range while OI keeps rising, deleveraging-driven volatility may further intensify.