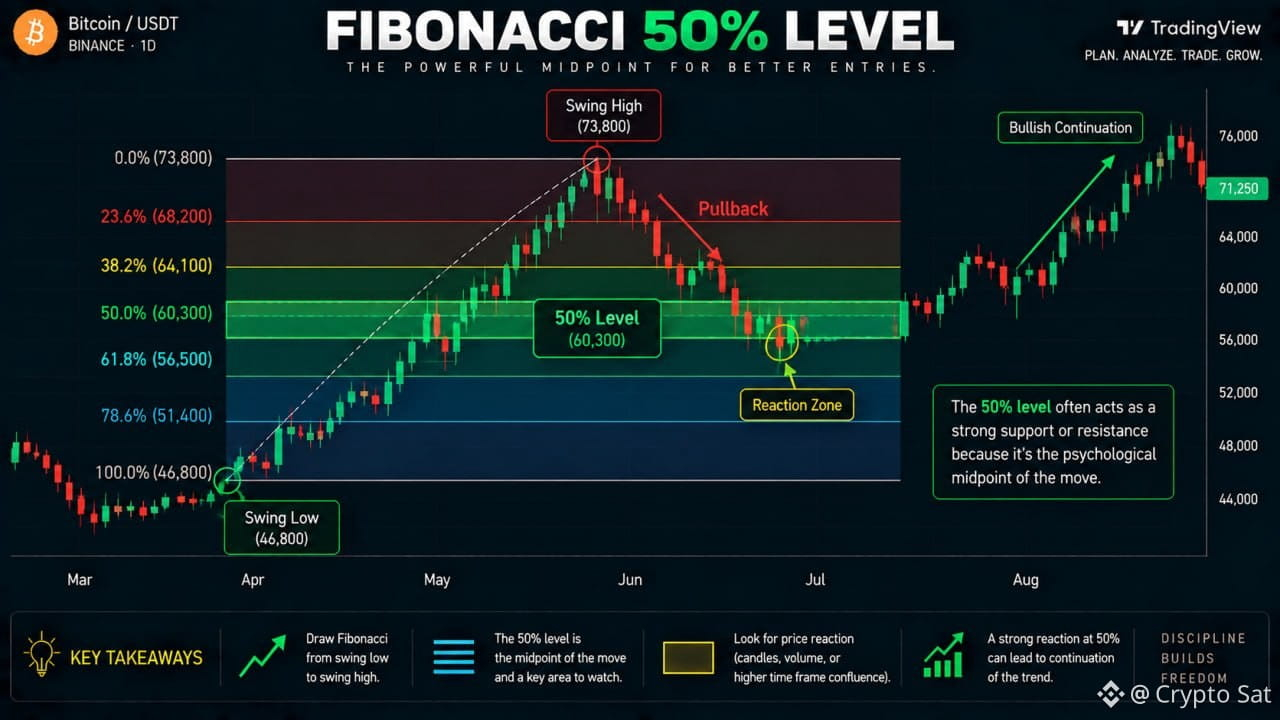
Fibonacci 50% Level
When Bitcoin makes a strong move, traders often ask:
“How deep could the pullback go?” 👀
One level they frequently watch is the 50% Fibonacci level.
🔹 What Does 50% Represent?
The 50% level represents the midpoint of a price move.
For example:
BTC moves from $80K → $100K.
A 50% retracement would bring price back around $90K.
It means price has given back roughly half of the previous move.
🎯 Why Watch the Midpoint?
Markets don't always reverse at the exact same levels.
But the midpoint can become an area where traders start watching for a potential reaction.
If BTC pulls back toward 50% and that area also has previous support, buyers may become interested.
The opposite can apply during a bearish move when the 50% area overlaps with resistance.
⚠️ 50% Isn't Technically a Fibonacci Ratio
Here's an important detail.
50% is not derived from the Fibonacci sequence.
It is included in Fibonacci retracement tools mainly because traders widely observe the halfway point of a move and it has become a commonly watched technical level.
So don't treat 50% as some magical Fibonacci number.
🔥 Confluence + Confirmation
A 50% level alone isn't enough for a trade.
Look for additional evidence:
▪️ Support or resistance
▪️ Market structure
▪️ Strong rejection candle
▪️ Volume
▪️ Trend direction
▪️ Retest confirmation
The more factors align, the more interesting the setup can become.
Remember:
•50% gives you an area to watch.
•Confluence gives you context.
•Confirmation gives you confidence.
Don't trade the midpoint blindly. Wait for price to show you what it wants to do. 🚀
When Bitcoin makes a strong move, traders often ask:
“How deep could the pullback go?” 👀
One level they frequently watch is the 50% Fibonacci level.
🔹 What Does 50% Represent?
The 50% level represents the midpoint of a price move.
For example:
BTC moves from $80K → $100K.
A 50% retracement would bring price back around $90K.
It means price has given back roughly half of the previous move.
🎯 Why Watch the Midpoint?
Markets don't always reverse at the exact same levels.
But the midpoint can become an area where traders start watching for a potential reaction.
If BTC pulls back toward 50% and that area also has previous support, buyers may become interested.
The opposite can apply during a bearish move when the 50% area overlaps with resistance.
⚠️ 50% Isn't Technically a Fibonacci Ratio
Here's an important detail.
50% is not derived from the Fibonacci sequence.
It is included in Fibonacci retracement tools mainly because traders widely observe the halfway point of a move and it has become a commonly watched technical level.
So don't treat 50% as some magical Fibonacci number.
🔥 Confluence + Confirmation
A 50% level alone isn't enough for a trade.
Look for additional evidence:
▪️ Support or resistance
▪️ Market structure
▪️ Strong rejection candle
▪️ Volume
▪️ Trend direction
▪️ Retest confirmation
The more factors align, the more interesting the setup can become.
Remember:
•50% gives you an area to watch.
•Confluence gives you context.
•Confirmation gives you confidence.
Don't trade the midpoint blindly. Wait for price to show you what it wants to do. 🚀