

In the crypto market, the chart is not random—it’s a map of liquidity. While beginners look at a red candle and a long wick as a sell signal, professionals see a "liquidity pool" (Liquidity Pool) that has been targeted. Why do 90% of traders fail even when they correctly identify support and resistance zones? Because they don’t analyze "how" price reached that zone.
1. Beyond the visible chart (Liquidity Sweeps):
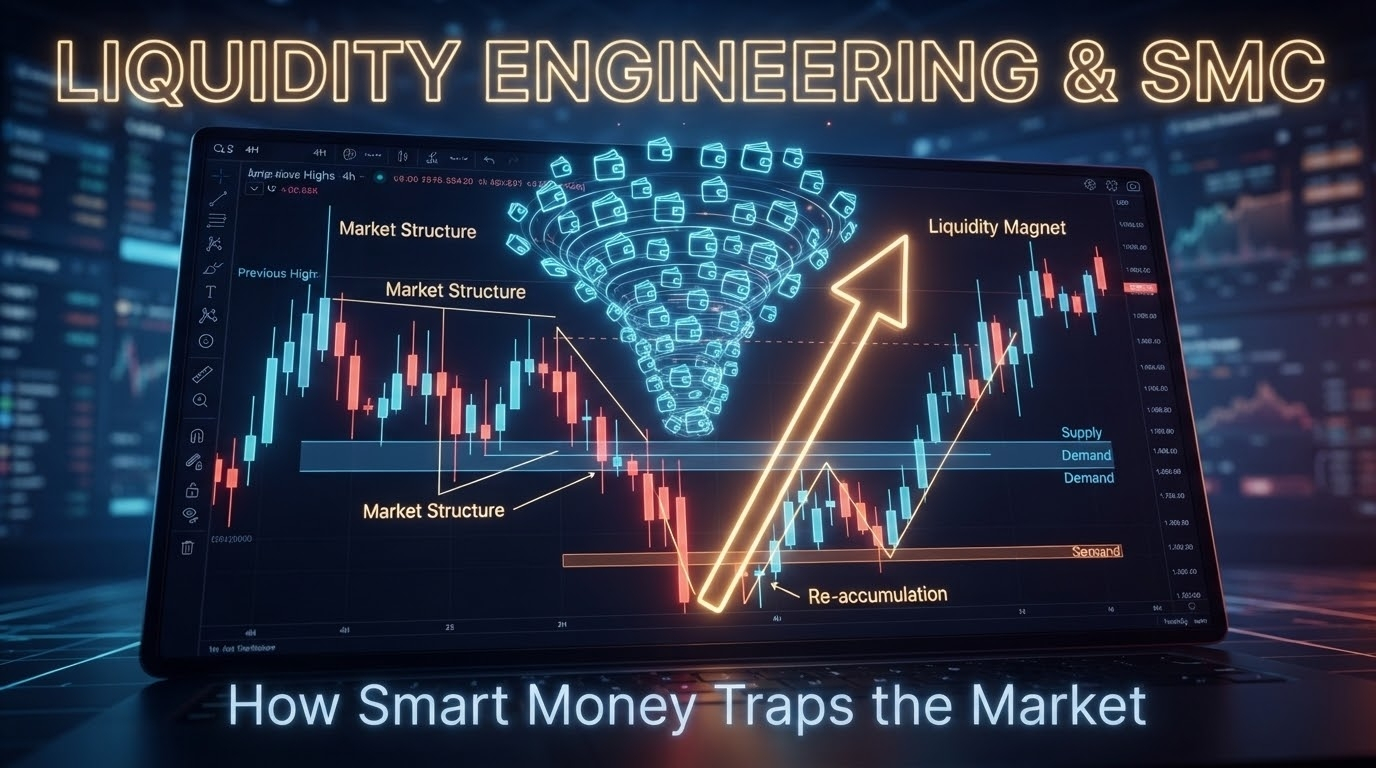
In the crypto market, market makers (whales) manipulate prices to create "liquidity traps." When beginners see a bearish candle with a very long lower wick (Pinbar) as a buy signal, the professional sees it as a "liquidity pool" targeted to hit the stop-loss orders of traders who entered early at support. This is the core of a Liquidity Sweep.
2. Accumulation Zone Anatomy:
Breaks the classic definition of sideway accumulation. Here, we’re talking about a deliberate "Bear Trap" at the bottoms of accumulation zones. Market makers don’t just do horizontal accumulation—they break the main support zone with weak volume (Sweeping the lows) to force the panicked ones to sell and collect their positions, then sharply reverse the price.
3. Market Structure and Hidden Divergence (Hidden Divergence):
To distinguish a Sweep from a real break, don’t rely on the classic RSI divergence. Use "Market Structure" analysis on smaller timeframes (1H/15m) within the accumulation zone on the 4H timeframe. The real Sweep ends when we see a shift in the sub-market structure (Market Structure Shift - MSS) on the exact timeframes after the price revisits the range.
4. Professional Risk Management for SMC:
Why not place your stop-loss at the very lowest point directly inside the accumulation zones? Because you’re then putting your money where market makers want it. Professionals place their stop-loss either far beyond the “obvious” support levels, or they wait for confirmation of the Sweep and a retest before entering with a tight stop-loss below the confirmation candle, in order to maximize the risk-to-reward ratio (R:R).
Bottom line:
Don’t trade based on the price touching support/resistance—trade based on how price interacts with liquidity at that zone. Wait for confirmation after the Sweep happens, and don’t be fuel for the whales’ engine.
💡 Question for professionals: Have you recently experienced a perfect 'Liquidity Sweep' on ETH or BTC? Share your chart in the comments so we can all learn how to read liquidity! 👇
#SMC #LiquidityGrab #SmartMoney #CryptoTradingPro #BinanceSquare #TechnicalAnalysis #ALPHA
