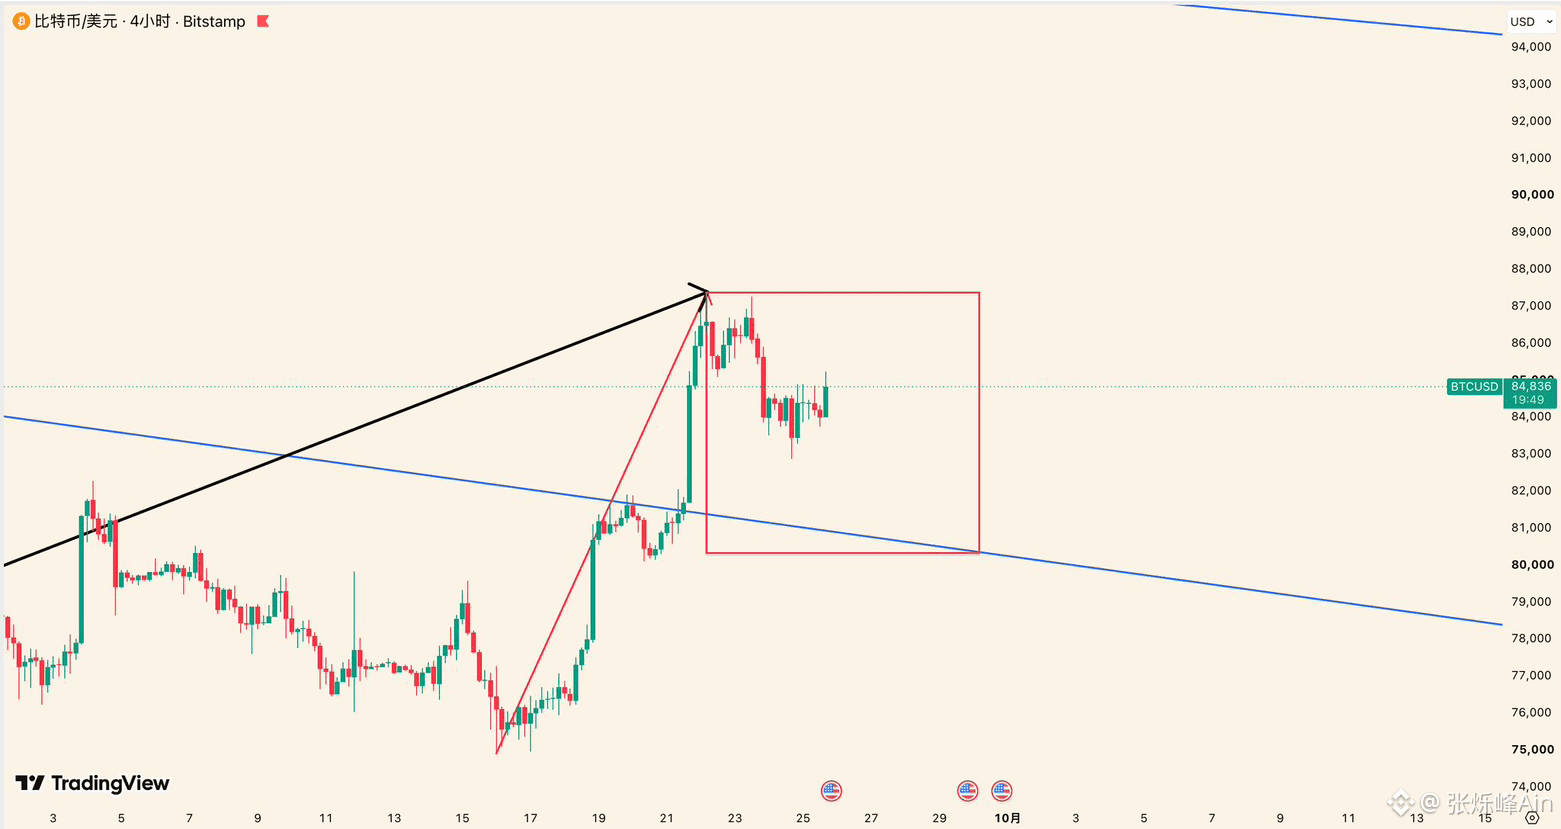
In the tweet on September 23, it said that when BTC broke below 84,500, it marked the start of a pullback for the uptrend from 74,967–87,395. After BTC broke 84,500, it then fell to 82,874—exactly landing within our target range of 83,400–82,600.
Since BTC has risen from 82,874 by more than 2,000 points+, what should we look at next?
In the video on Sunday, it was mentioned that the blue Gann angle line 2/1 in the chart (currently at 80,300–80,700) is the bull–bear boundary. As long as BTC can hold above it, the decline starting from 87,395 can be treated as a pullback against the rise in the red segment shown in the chart—this pullback is at a daily-chart level. Once the end of the pullback is found, the next upward move has the potential to test 89,800.
If BTC breaks below the blue Gann angle line 2/1 and cannot reclaim it, then the pullback expands into the entire uptrend that started from 57,800—this is at a weekly-chart level.
Tracking the smaller timeframes every day is meant to help everyone understand how BTC’s market is progressing. Compared with trying to catch every opportunity on the small timeframe, it’s clearly easier to profit by finding chances to ride the larger timeframe trend.
Over the past year, using Gann theory we successfully called the bull top in October 2025, and the stage low point—57,800 on July 1, 2026—has also been verified. There are countless turning points at the next level as well.
My medium- to long-term buy/sell strategy and short-term swing updates are synchronized in real time in the 🐼 channel. If you’re interested, please ➡️$BTC
#BTC走势分析
Since BTC has risen from 82,874 by more than 2,000 points+, what should we look at next?
In the video on Sunday, it was mentioned that the blue Gann angle line 2/1 in the chart (currently at 80,300–80,700) is the bull–bear boundary. As long as BTC can hold above it, the decline starting from 87,395 can be treated as a pullback against the rise in the red segment shown in the chart—this pullback is at a daily-chart level. Once the end of the pullback is found, the next upward move has the potential to test 89,800.
If BTC breaks below the blue Gann angle line 2/1 and cannot reclaim it, then the pullback expands into the entire uptrend that started from 57,800—this is at a weekly-chart level.
Tracking the smaller timeframes every day is meant to help everyone understand how BTC’s market is progressing. Compared with trying to catch every opportunity on the small timeframe, it’s clearly easier to profit by finding chances to ride the larger timeframe trend.
Over the past year, using Gann theory we successfully called the bull top in October 2025, and the stage low point—57,800 on July 1, 2026—has also been verified. There are countless turning points at the next level as well.
My medium- to long-term buy/sell strategy and short-term swing updates are synchronized in real time in the 🐼 channel. If you’re interested, please ➡️$BTC
#BTC走势分析