


Hello, esteemed Binance Square community! 👋
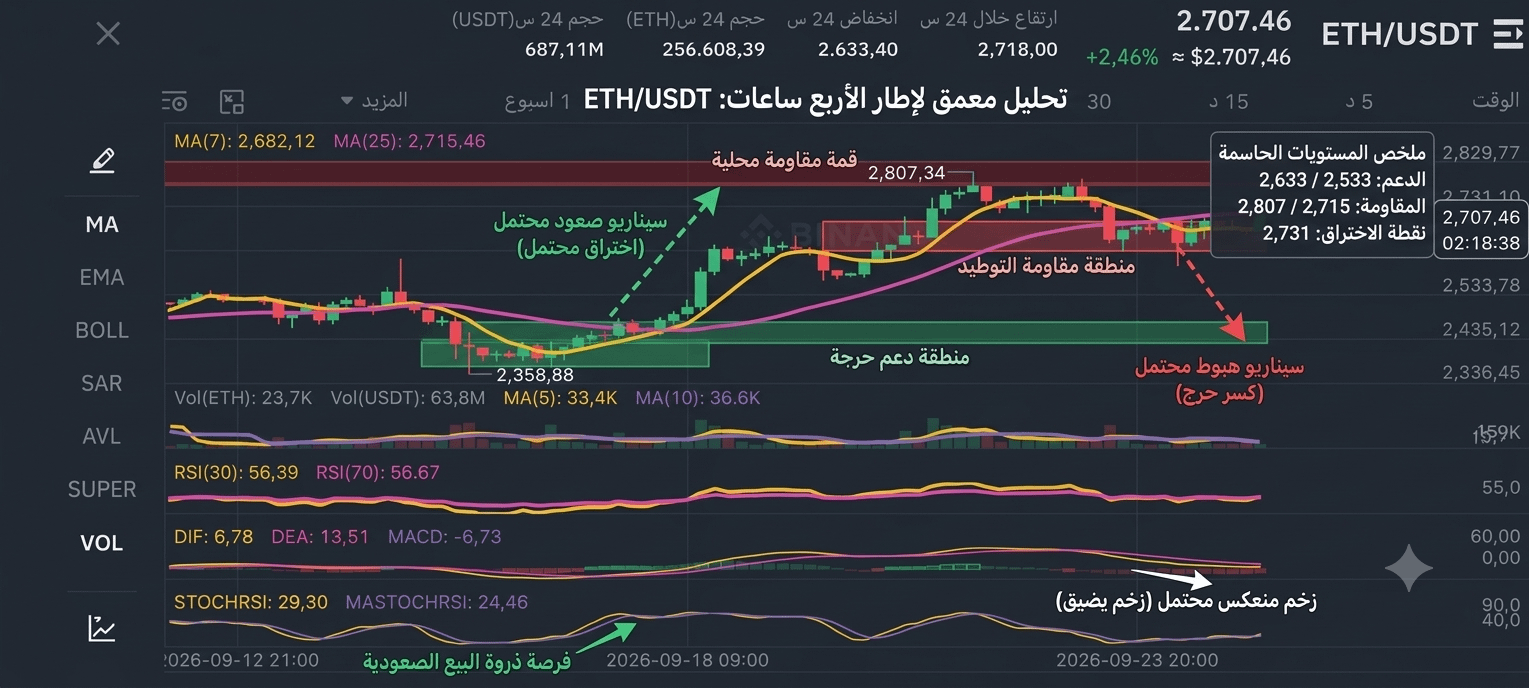
The husband ETH/USDT is currently in a crucial and sensitive consolidation phase on the 4-hour timeframe, confined between key support levels and a strong local peak reached recently. After a strong rebound from the 2,358 USDT low, the price met severe resistance at 2,807.34 USDT, causing it to drop to its current level.
Technical indicators show mixed signals: while Stoch RSI indicates oversold conditions and a possible bullish rebound, MACD is still bearish but narrowing, suggesting the downward momentum is fading. The RSI is neutral but above 50, leaving the door open to all possibilities.
Critical support and resistance levels:
Consolidation resistance: the 2,731 USDT and MA(25). A sustained breakout of this area is the key to further upside.
Local resistance top: the 2,807.34 USDT. Breaking above it will open the door to levels around 2,829 or higher.
Critical support area: the 2,633 USDT. A sustained break below it will lead to a decline toward 2,533 USDT.
Possible scenarios:
Bullish scenario (breakout above 2,731): If the price manages to break above 2,731 and MA(25) decisively, supported by oversold Stoch RSI, it will target 2,807.34. Any successful breakout above 2,807 would signal the end of the correction phase and the beginning of a new upward wave.
Bearish scenario (breakdown below 2,633): If the price fails to break upward and decisively breaks below 2,633 USDT, it will indicate the continuation of the bearish correction, which may lead to a decline toward 2,533 or lower.
Trading tip:
The market is currently in a state of indecision, and it is preferable to wait for a decisive breakout above the 2,731 resistance or a decisive breakdown below the 2,633 support before making major trading decisions. Monitoring trading volume at the breakout or breakdown is essential to confirm the move.
Third: the professionally edited image
The following image is the professionally edited image, with explanatory layers added to it in Arabic:
Identifying the local top: a dark red line at 2,807.34 labeled "Local resistance top".
Identifying the consolidation resistance area: a light red rectangle marking the 2,715-2,731 zone. Labeled "Consolidation resistance area (retest)".
Identifying a critical support area: a dark green line and green shading marking the 2,633 level. Labeled "Critical support area".
Possible scenarios: dashed illustrative arrows (green and red) indicate the expected price path in both the bullish and bearish scenarios, with breakout or breakdown conditions.
Indicator clarification: green and red arrows on Stoch RSI and MACD indicate technical signals (oversold, momentum tightening).
Summary of critical levels: a side text box titled "Summary of critical levels" summarizing the most important support and resistance levels.
#Ethereum #ETH #BinanceSquare #CryptoAnalysis #TechnicalAnalysis #نبض_الشارت
 ETH2,730.13+1.81%