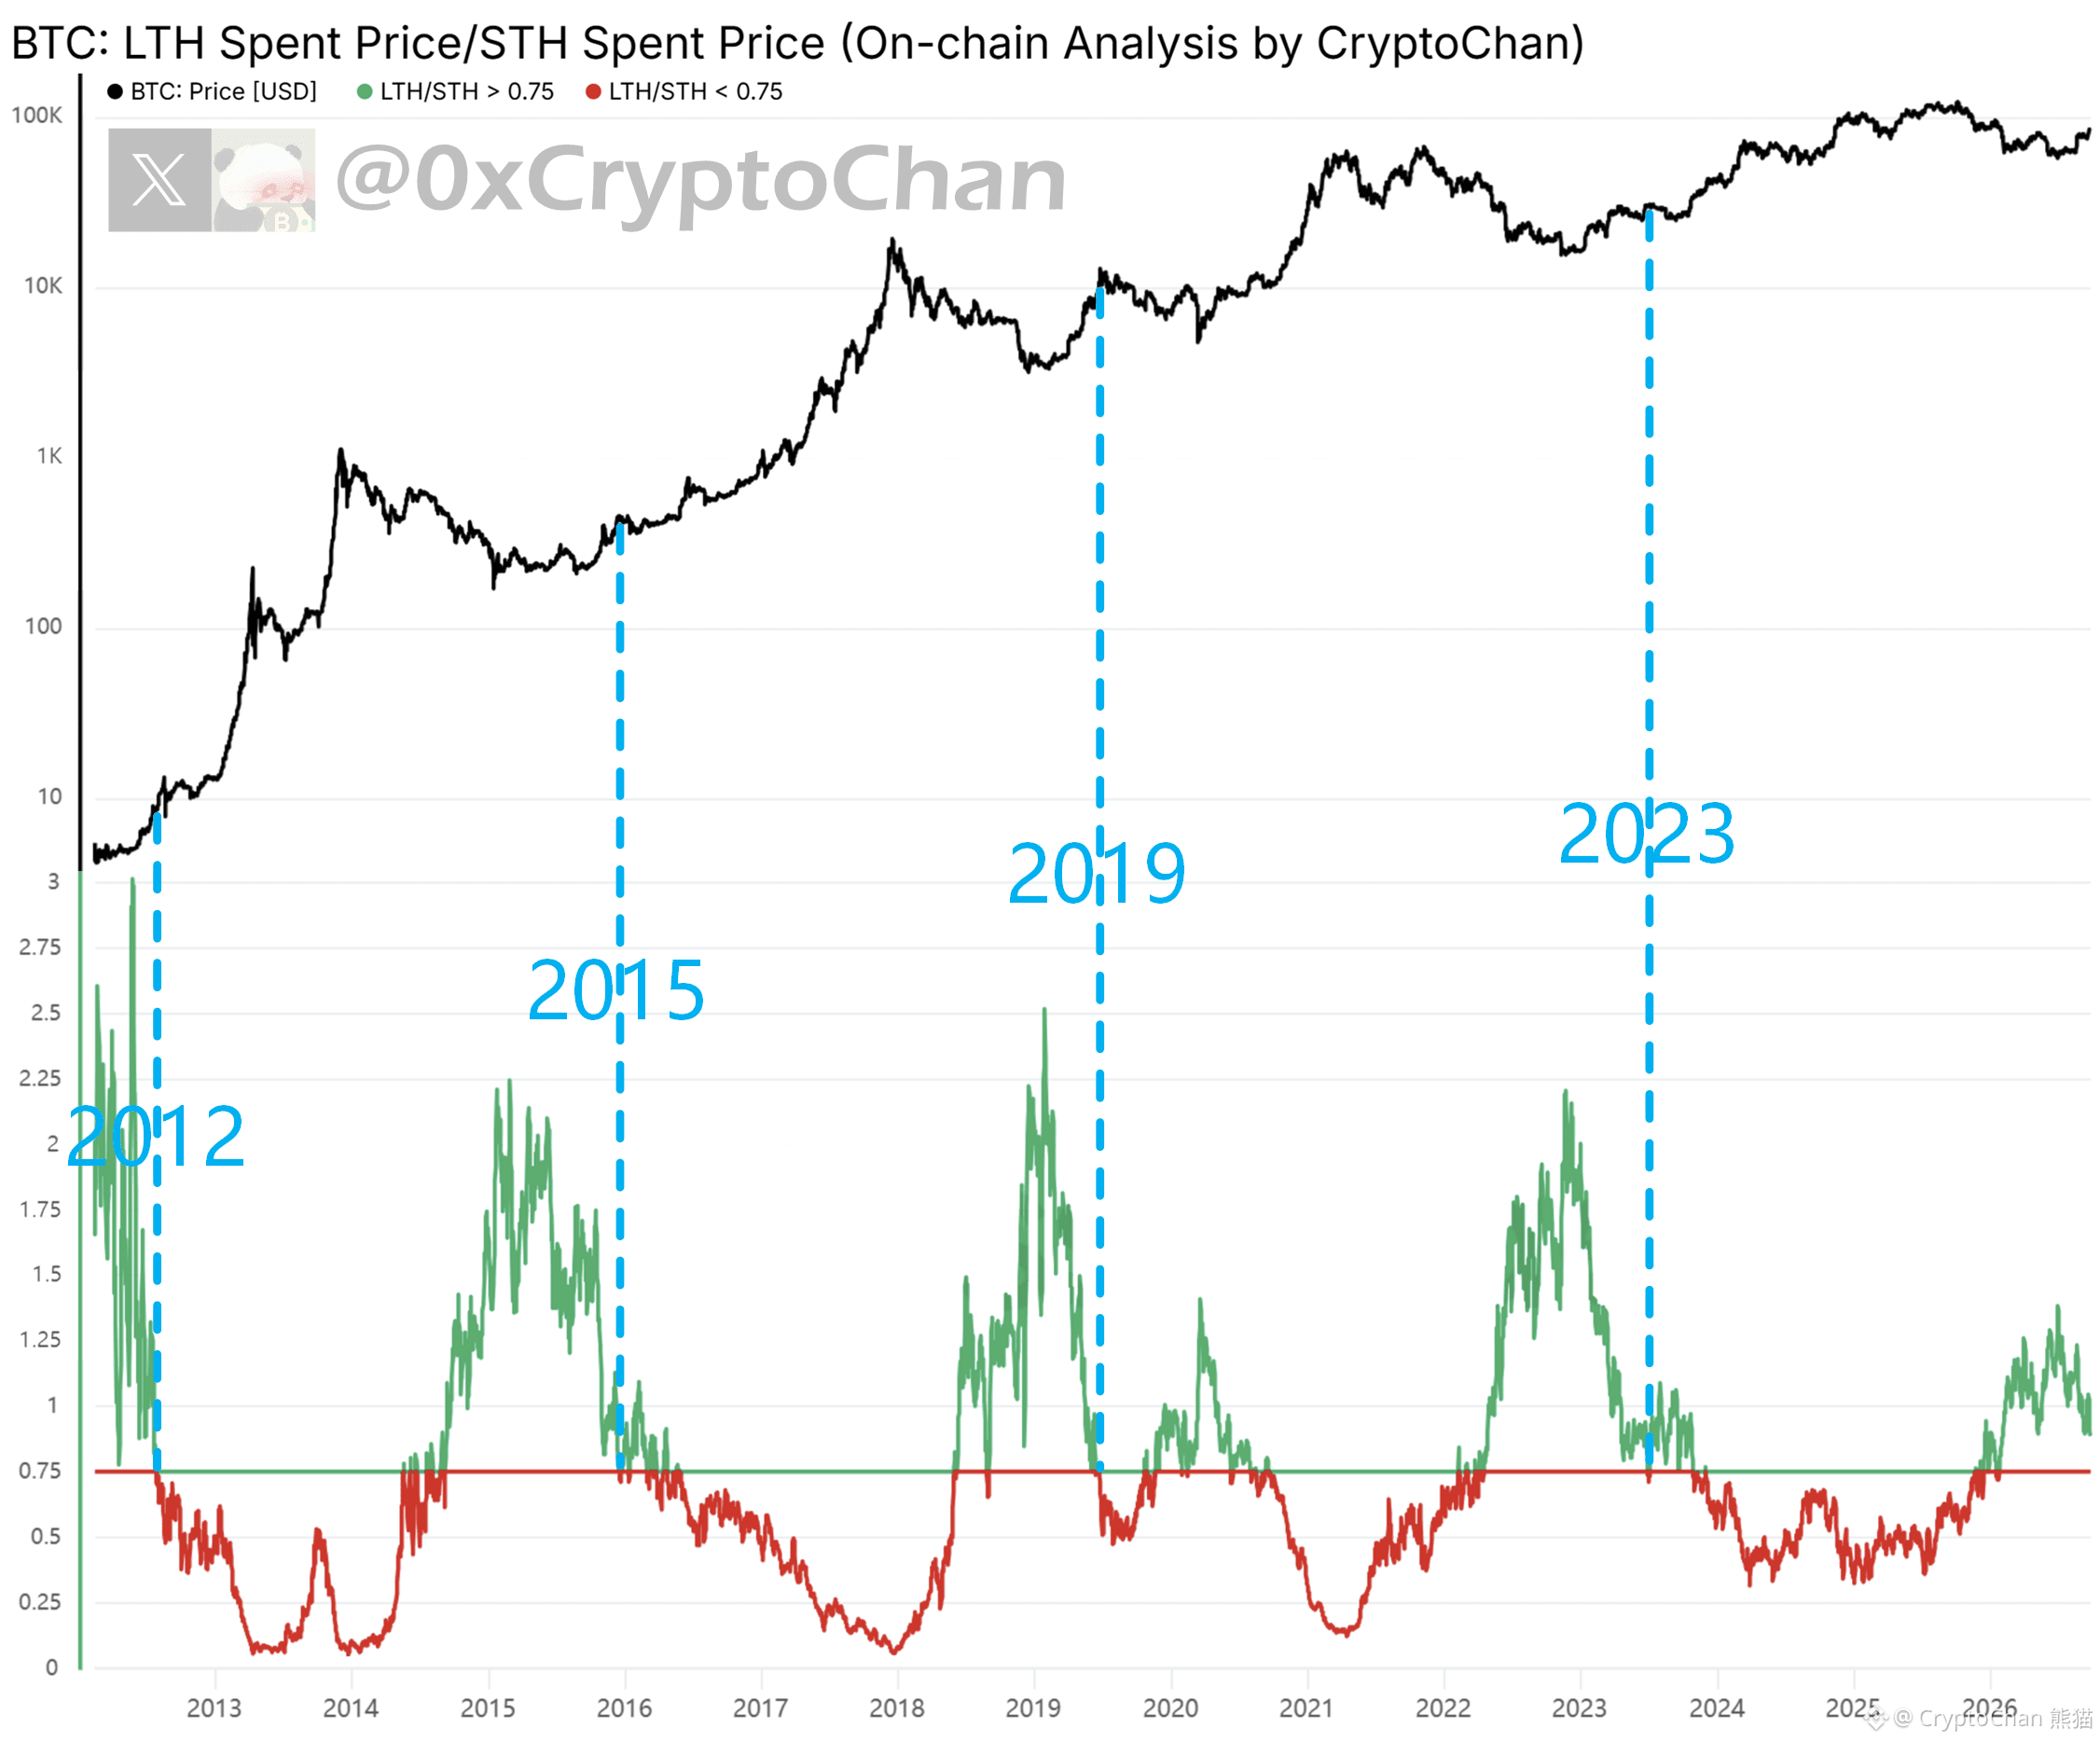
【 $BTC four-year cycle total cutting series 76】
2012 indicator turns red: BTC reaches near the bull market recovery top
2015 indicator turns red: BTC happens to reach the bull market recovery top
2019 indicator turns red: BTC happens to reach the bull market recovery top
2023 indicator turns red: BTC happens to reach the bull market recovery top
It hasn’t turned red yet
┌─ Indicator Details ─┐
The indicator at the bottom of the chart is the ratio of the average buy-in cost of on-chain long- and short-term coin holders’ selling positions ( >0.75 green; <0.75 red )
2012 indicator turns red: BTC reaches near the bull market recovery top
2015 indicator turns red: BTC happens to reach the bull market recovery top
2019 indicator turns red: BTC happens to reach the bull market recovery top
2023 indicator turns red: BTC happens to reach the bull market recovery top
It hasn’t turned red yet
┌─ Indicator Details ─┐
The indicator at the bottom of the chart is the ratio of the average buy-in cost of on-chain long- and short-term coin holders’ selling positions ( >0.75 green; <0.75 red )