📈 Is Bitcoin Pumping Again?
The 15-minute chart built something interesting overnight.
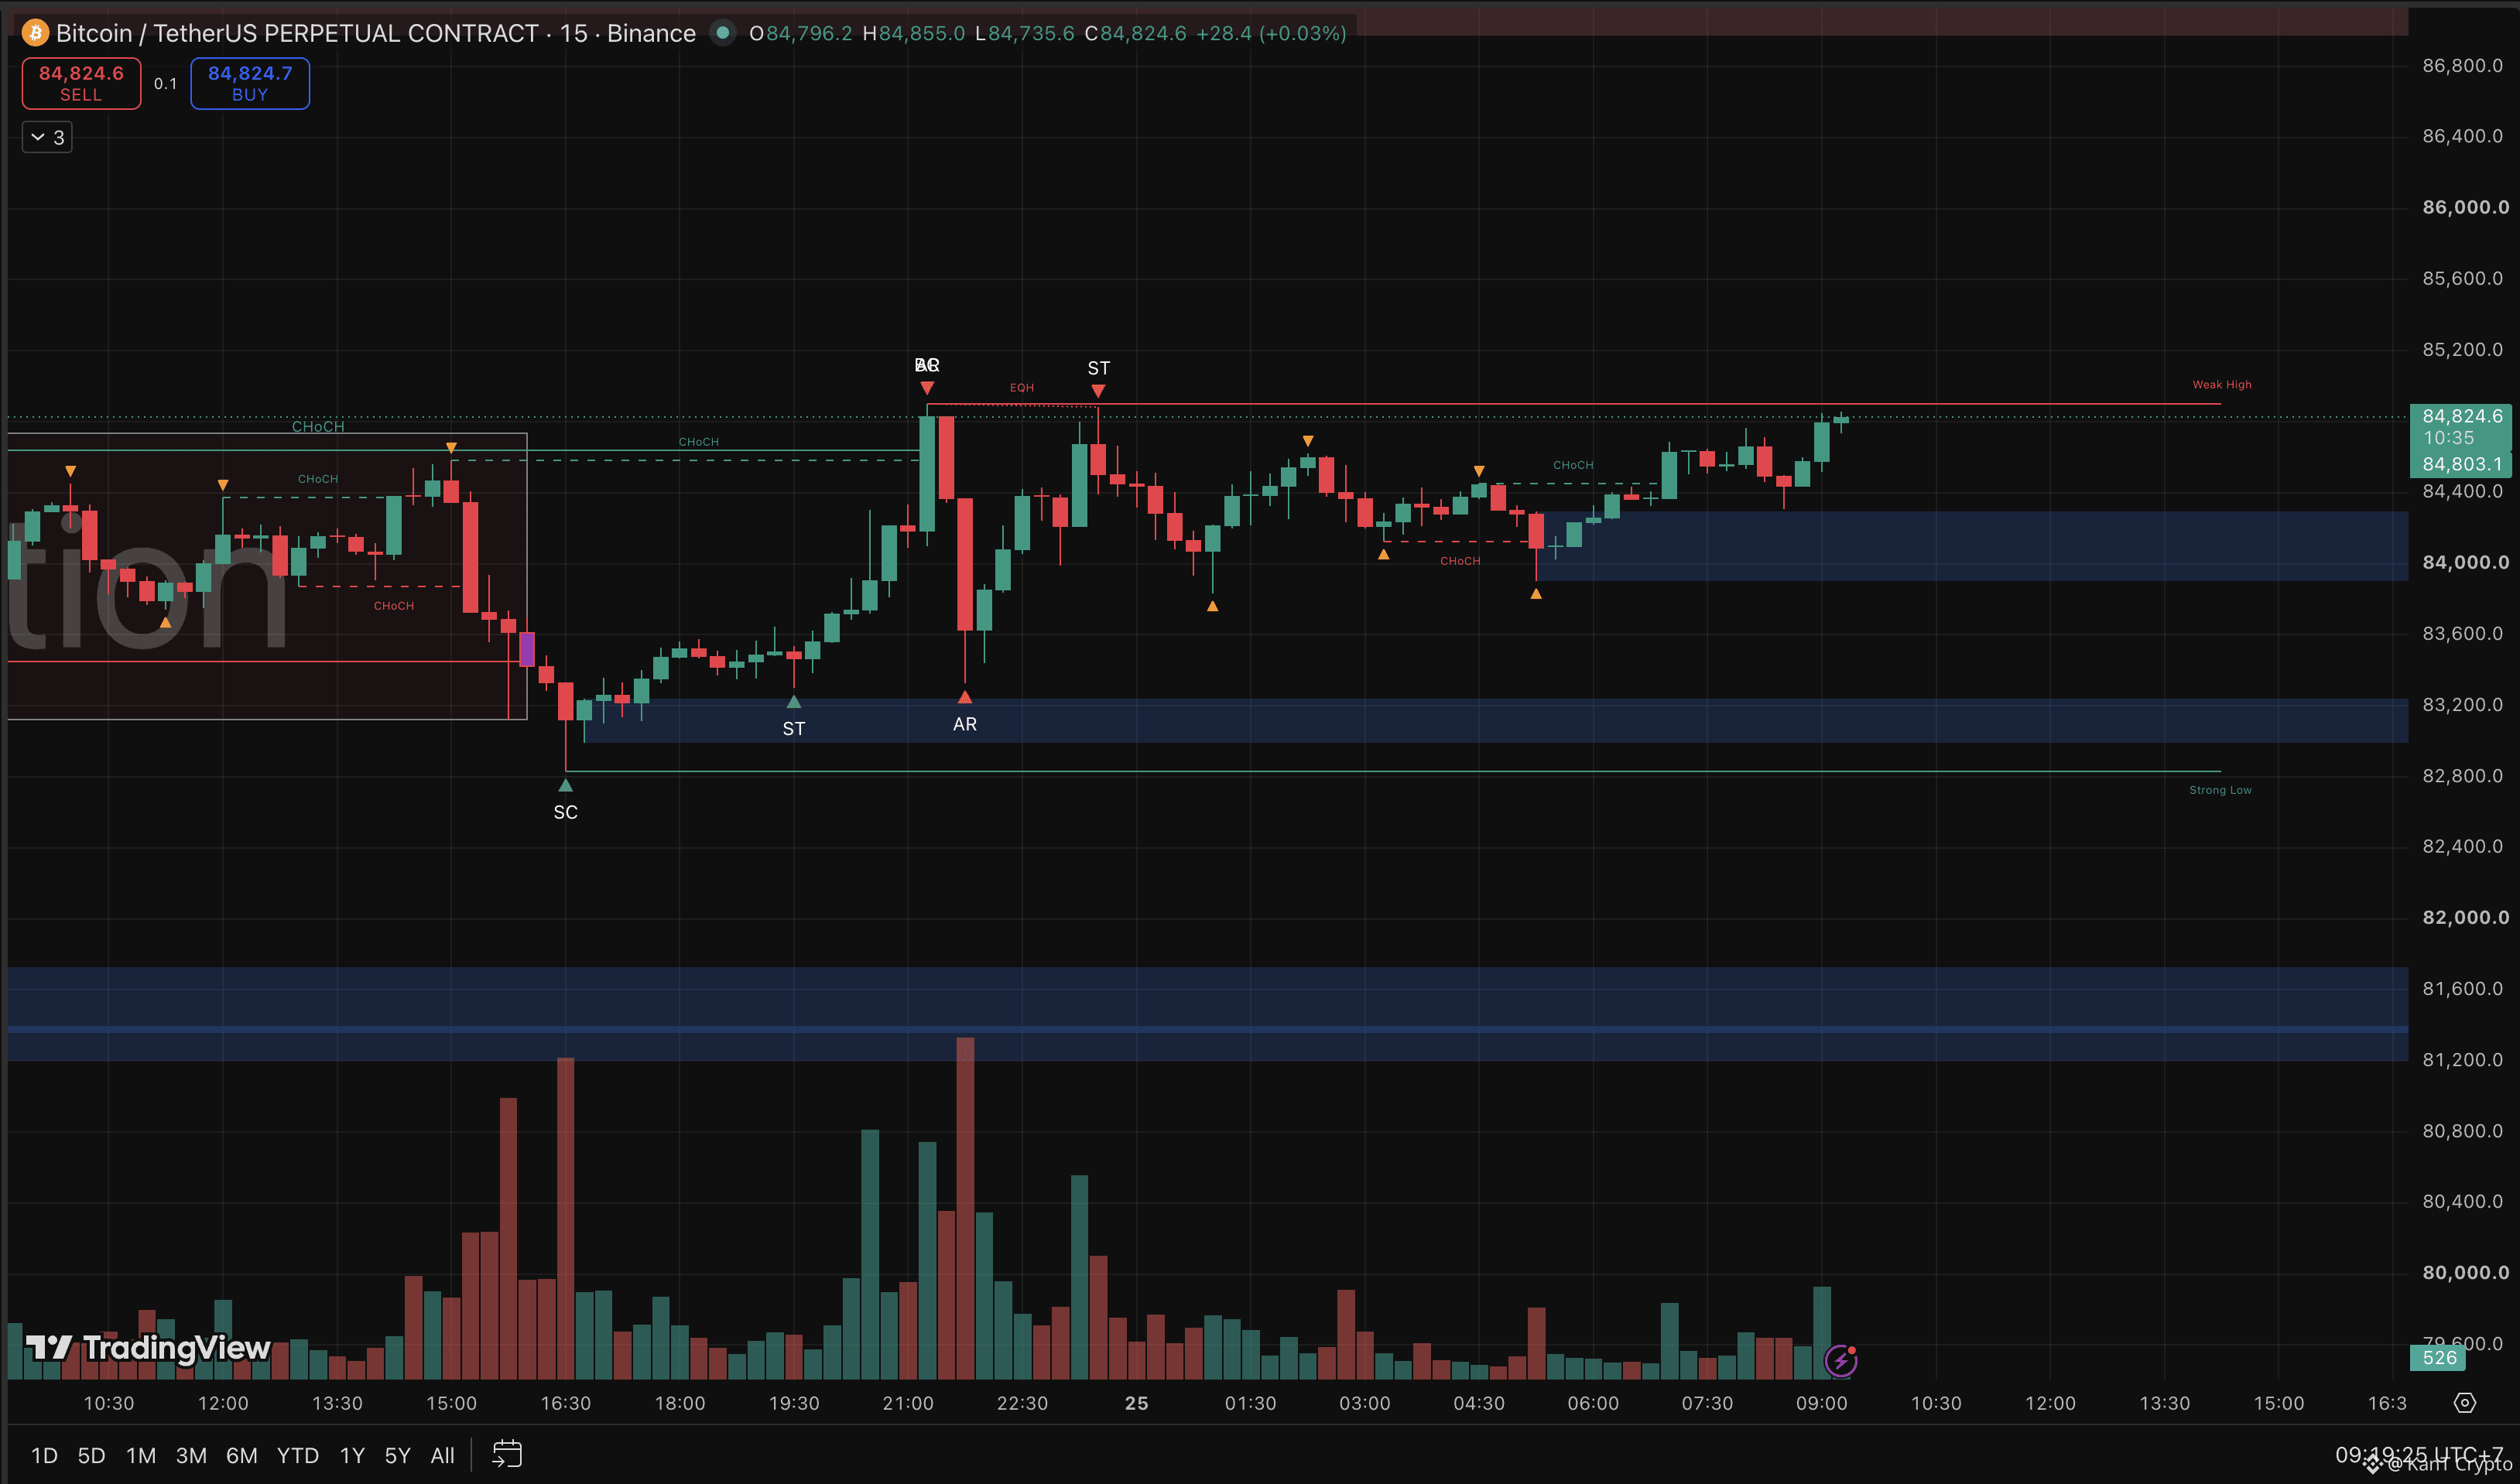
After yesterday's breakdown, BTC flushed to about $82,850 and sellers ran dry right there. The chart marks it a selling climax (SC), the moment panic peaks and bigger buyers start absorbing.
Since then, it looks a lot like a mini accumulation.
A bounce, a retest that held above the low, then higher lows stacking up.
The $83,900 to $84,300 zone got defended twice.
Now price is at $84,824, pressing the same $84,900 ceiling that rejected it twice before.
That ceiling is the whole story. 👀
Two taps at one level leave equal highs, and equal highs are where stop orders pile up. Break it, and those stops can fuel a quick squeeze. Fail again, and it turns into a triple top.
Keep the timeframe in mind. This is a 15-minute structure. It can spark a move, but the level that matters on the bigger chart is still $85K, and a 4H close above it is what turns a bounce into a recovery.
Break $84,900 and hold, and $85,500 to $86K opens up.
Lose $83,900, and the bounce is done, with $83,000 back in focus.
All this with the US 10-year yield at a 19-year high. The resilience is real, and so is the pressure.
Squeeze through $84.9K, or another rejection at the ceiling? 🔥
Not financial advice.
$BTC
$BNB
$ETH
The 15-minute chart built something interesting overnight.
After yesterday's breakdown, BTC flushed to about $82,850 and sellers ran dry right there. The chart marks it a selling climax (SC), the moment panic peaks and bigger buyers start absorbing.
Since then, it looks a lot like a mini accumulation.
A bounce, a retest that held above the low, then higher lows stacking up.
The $83,900 to $84,300 zone got defended twice.
Now price is at $84,824, pressing the same $84,900 ceiling that rejected it twice before.
That ceiling is the whole story. 👀
Two taps at one level leave equal highs, and equal highs are where stop orders pile up. Break it, and those stops can fuel a quick squeeze. Fail again, and it turns into a triple top.
Keep the timeframe in mind. This is a 15-minute structure. It can spark a move, but the level that matters on the bigger chart is still $85K, and a 4H close above it is what turns a bounce into a recovery.
Break $84,900 and hold, and $85,500 to $86K opens up.
Lose $83,900, and the bounce is done, with $83,000 back in focus.
All this with the US 10-year yield at a 19-year high. The resilience is real, and so is the pressure.
Squeeze through $84.9K, or another rejection at the ceiling? 🔥
Not financial advice.
$BTC
$BNB
$ETH