

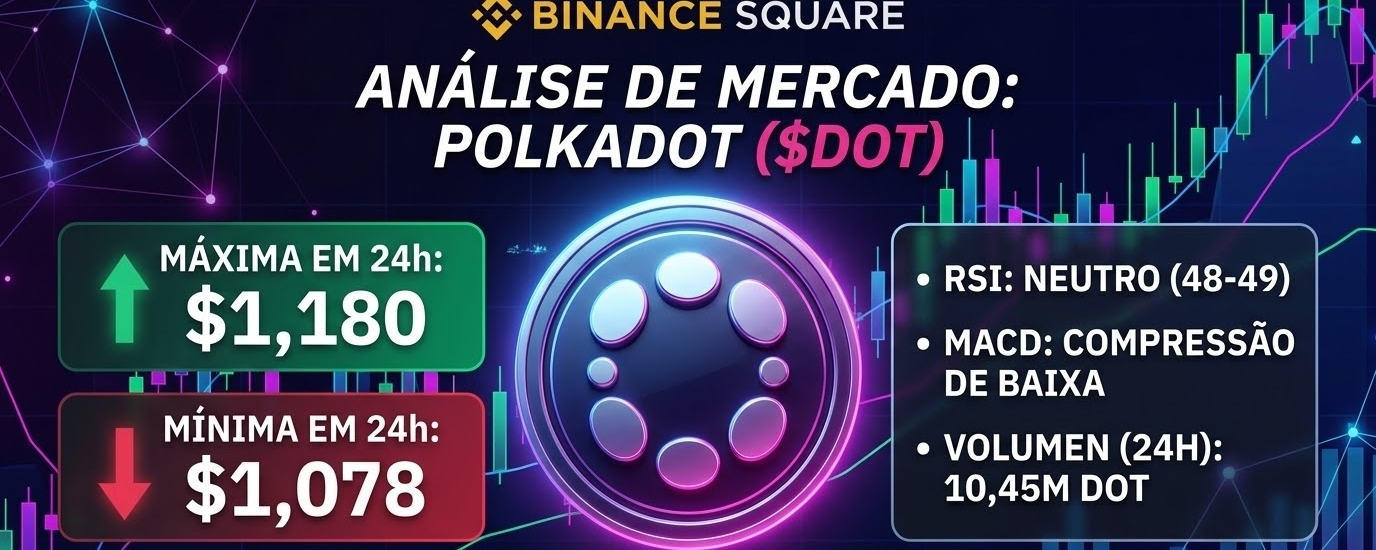

Hey, Binance Square community! Today we’re focusing on Polkadot ($DOT), which has been facing a sharp corrective move. For those who follow the charts, volatility has left very clear boundaries over the last 24 hours:
📉 24h low: $1.078
📈 24h high: $1.180
(Price currently being traded in the $1.15 range)
This move confirms that $DOT suffered strong selling pressure, losing important supports before finding a defense at the $1.078 bottom. But what do the data tell us about this drop and the next steps?
🔍 Current Technical Indicators
RSI (Relative Strength Index): Trading around 48-49 (Neutral). The indicator has cooled significantly after the drop and exited oversold zones. However, the lack of upward strength (momentum) shows that buyers have not yet regained control of the asset.
MACD: Still bearish and compressed. The histogram is still struggling to gain consistent positive territory, confirming that selling pressure sets the pace and that the current recovery attempt lacks real volume.
Moving Averages: The current short-term structure is bearish. The price is squeezed and trading below its main moving averages, turning previous supports into heavier resistances.
🎯 What to Expect?
$DOT is in a consolidation attempt zone after the strong impact.
Recovery Scenario: To negate the immediate downward bias and breathe, a strong breakout—supported by volume—above the $1.180 high is needed. This would pave the way to retest the $1.20 to $1.22 area.
Alert Scenario (Bearish): The $1.078 level is the vital short-term support. If selling pressure returns and we lose this daily low, the drop could intensify quickly, with the market searching the psychological $1.00 range—or even lower levels.
During post-drop consolidation moments, trading while trying to "catch a falling knife" is very risky. Waiting for confirmation of direction and volume is the best approach.
Notice: Educational analysis. It does not constitute investment advice (DYOR).
#Polkadot #dot #analisetecnica #BinanceSquare #cryptotrading