$PROVE
/USDT: The 0.2204 Rebound Explained
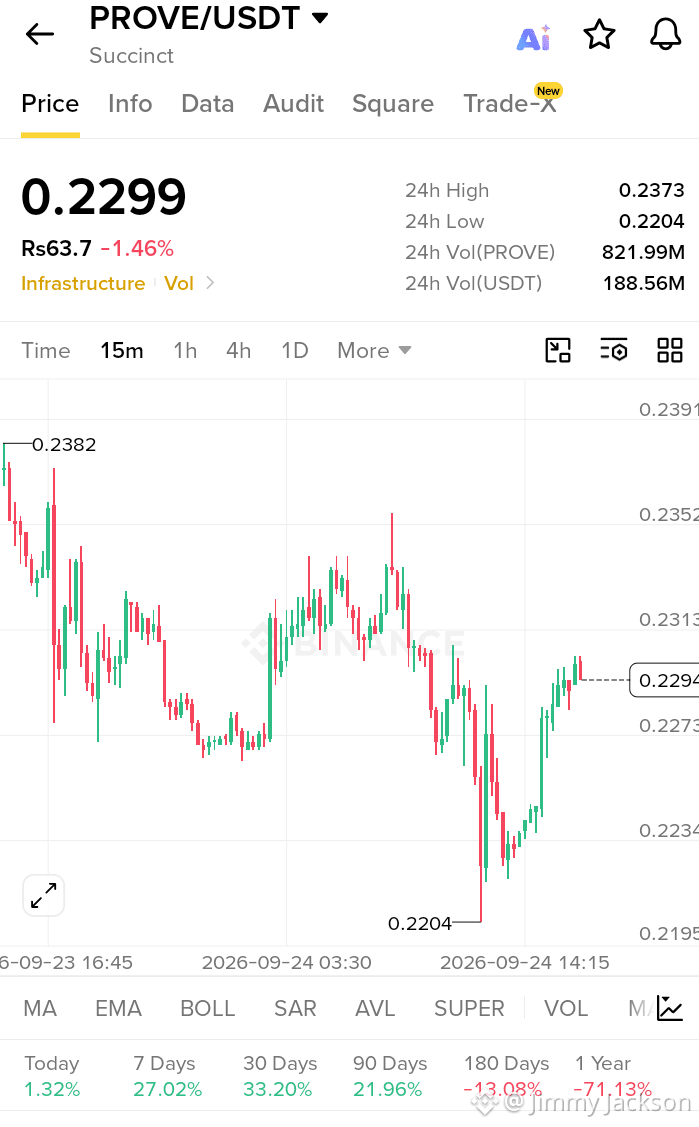
The recent 3% pump on PROVE/USDT isn't random; it’s a textbook technical bounce backed by sector rotation. After a grueling downtrend, the asset flushed out weak hands at a 24h low of 0.2204. This level acted as a "liquidity grab," triggering a sharp V-shaped recovery as spot buyers aggressively defended the support zone.
Deep Analysis
1. Technical Setup: The 15m chart reveals a "Spring" pattern. The dip below previous consolidation allowed market makers to fill buy orders before pushing price back above 0.2290. We are now testing immediate resistance at 0.2300. A confirmed breakout here could target the 24h high of 0.2373.
2. Volume Dynamics: The 24h volume of 188M USDT is substantial. This isn't a low-liquidity wick; real capital is rotating back into the "Infrastructure" narrative.
3. Macro Context: Despite the recent 7-day gain of 27%, PROVE remains down 71% yearly. This deep discount makes it a prime target for high-risk contrarian traders looking for oversold bounces.
New Information
Watch the RSI on the 1H chart. It is exiting oversold territory and sloping upward, suggesting momentum is shifting bullish. However, the 0.2373 level remains a strong "take-profit" wall.
Verdict: This is a relief rally. If Bitcoin holds steady, PROVE could fill the gap to 0.24. Use tight stop-losses below 0.2200.
Please don’t forget to like, follow, and share! 🩸 Thank you so much ❤️
#BinanceWillListHyperliquid(HYPE) #FedOctoberRateHikeOddsRiseTo69.7% #US30YearYieldHighestSince2004
/USDT: The 0.2204 Rebound Explained
The recent 3% pump on PROVE/USDT isn't random; it’s a textbook technical bounce backed by sector rotation. After a grueling downtrend, the asset flushed out weak hands at a 24h low of 0.2204. This level acted as a "liquidity grab," triggering a sharp V-shaped recovery as spot buyers aggressively defended the support zone.
Deep Analysis
1. Technical Setup: The 15m chart reveals a "Spring" pattern. The dip below previous consolidation allowed market makers to fill buy orders before pushing price back above 0.2290. We are now testing immediate resistance at 0.2300. A confirmed breakout here could target the 24h high of 0.2373.
2. Volume Dynamics: The 24h volume of 188M USDT is substantial. This isn't a low-liquidity wick; real capital is rotating back into the "Infrastructure" narrative.
3. Macro Context: Despite the recent 7-day gain of 27%, PROVE remains down 71% yearly. This deep discount makes it a prime target for high-risk contrarian traders looking for oversold bounces.
New Information
Watch the RSI on the 1H chart. It is exiting oversold territory and sloping upward, suggesting momentum is shifting bullish. However, the 0.2373 level remains a strong "take-profit" wall.
Verdict: This is a relief rally. If Bitcoin holds steady, PROVE could fill the gap to 0.24. Use tight stop-losses below 0.2200.
Please don’t forget to like, follow, and share! 🩸 Thank you so much ❤️
#BinanceWillListHyperliquid(HYPE) #FedOctoberRateHikeOddsRiseTo69.7% #US30YearYieldHighestSince2004