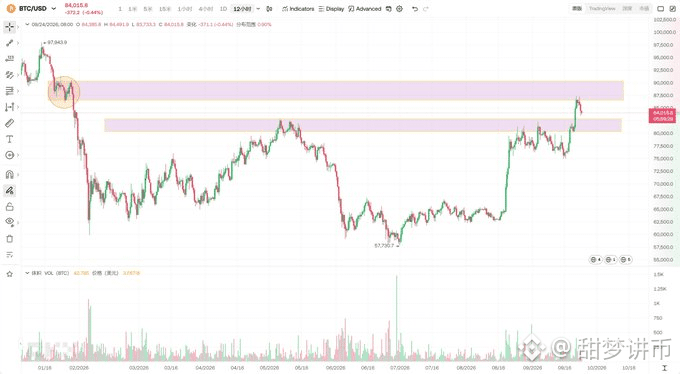
BTC After this spike upward and pullback, it has managed to play out both the upper and lower key zones exactly.
The shaded areas in the chart are the resistance and support levels:
Below: $80k–$83k. This has been suppressing the price for a long time, and after the breakout it has now turned into support;
Above: $86.5k–$90k. This is the platform that was broken down at the beginning of the year, and it has now become a resistance zone again.
Currently, after BTC pushed into the upper resistance zone, it was knocked back to around $84k, which shows that sell pressure here is still significant. The downside support has held. This pullback is a normal confirmation after a breakout. After that, there will still be an opportunity to challenge the $86.5k–$90k range again. If it falls back below $80k, it would suggest that this breakout is not a valid one, and the price would most likely return to the one-month consolidation range.
Next, I’ll see whether the shaded support area below can hold. If it holds, I’ll stay bullish; if it doesn’t, I’ll temporarily lower my expectations.
The shaded areas in the chart are the resistance and support levels:
Below: $80k–$83k. This has been suppressing the price for a long time, and after the breakout it has now turned into support;
Above: $86.5k–$90k. This is the platform that was broken down at the beginning of the year, and it has now become a resistance zone again.
Currently, after BTC pushed into the upper resistance zone, it was knocked back to around $84k, which shows that sell pressure here is still significant. The downside support has held. This pullback is a normal confirmation after a breakout. After that, there will still be an opportunity to challenge the $86.5k–$90k range again. If it falls back below $80k, it would suggest that this breakout is not a valid one, and the price would most likely return to the one-month consolidation range.
Next, I’ll see whether the shaded support area below can hold. If it holds, I’ll stay bullish; if it doesn’t, I’ll temporarily lower my expectations.