【 $BTC four-year cycle total notch series 74】
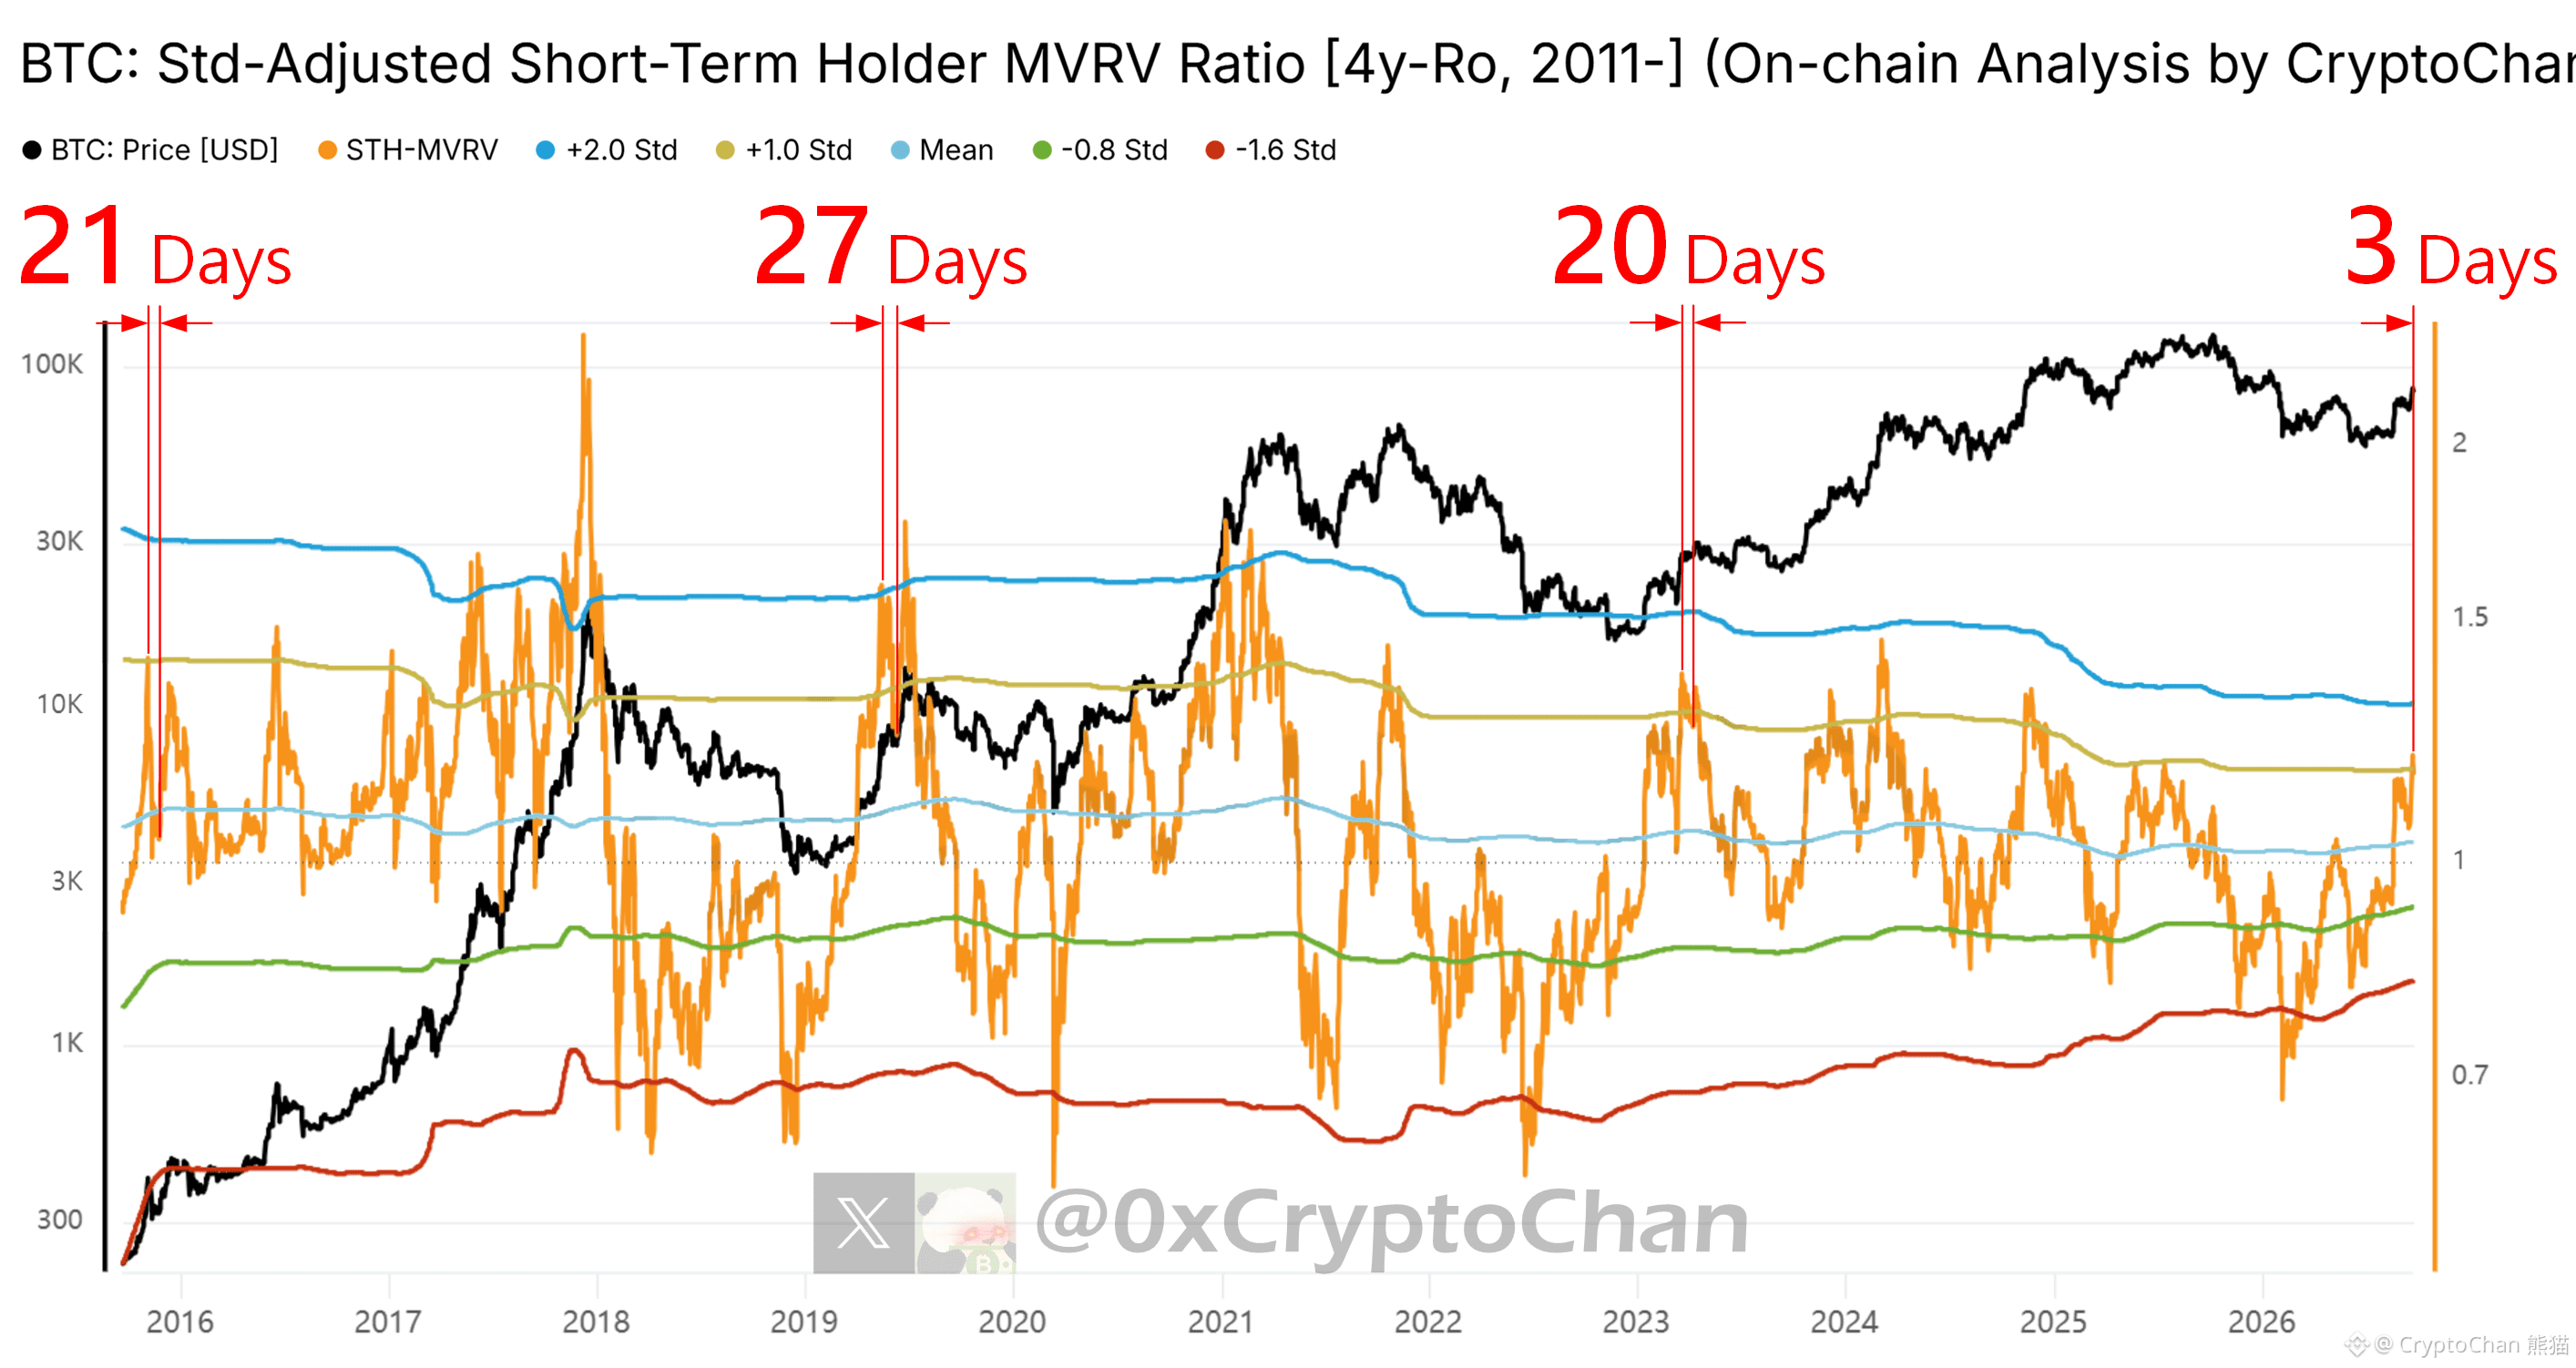
📌 In Nov 2015, this indicator broke above the +1 standard deviation line: after 21 days, it started the bull-market recovery top run
📌 In May 2019, this indicator broke above the +2 standard deviation line: after 27 days, it started the bull-market recovery top run
📌 In Mar 2023, this indicator broke above the +1 standard deviation line: after 20 days, it started the bull-market recovery secondary top run
📌 In Sep 2026, this indicator broke above the +1 standard deviation line: adjusted by 3 days
┌── 🐼 On-chain data details ──┐
Black line: Bitcoin price
Orange line: Bitcoin on-chain short-term holder MVRV, and its five standard deviation lines: +2σ, +1σ, 0σ, -0.8σ, -1.6σ (4-year rolling window sampled data)
📌 In Nov 2015, this indicator broke above the +1 standard deviation line: after 21 days, it started the bull-market recovery top run
📌 In May 2019, this indicator broke above the +2 standard deviation line: after 27 days, it started the bull-market recovery top run
📌 In Mar 2023, this indicator broke above the +1 standard deviation line: after 20 days, it started the bull-market recovery secondary top run
📌 In Sep 2026, this indicator broke above the +1 standard deviation line: adjusted by 3 days
┌── 🐼 On-chain data details ──┐
Black line: Bitcoin price
Orange line: Bitcoin on-chain short-term holder MVRV, and its five standard deviation lines: +2σ, +1σ, 0σ, -0.8σ, -1.6σ (4-year rolling window sampled data)