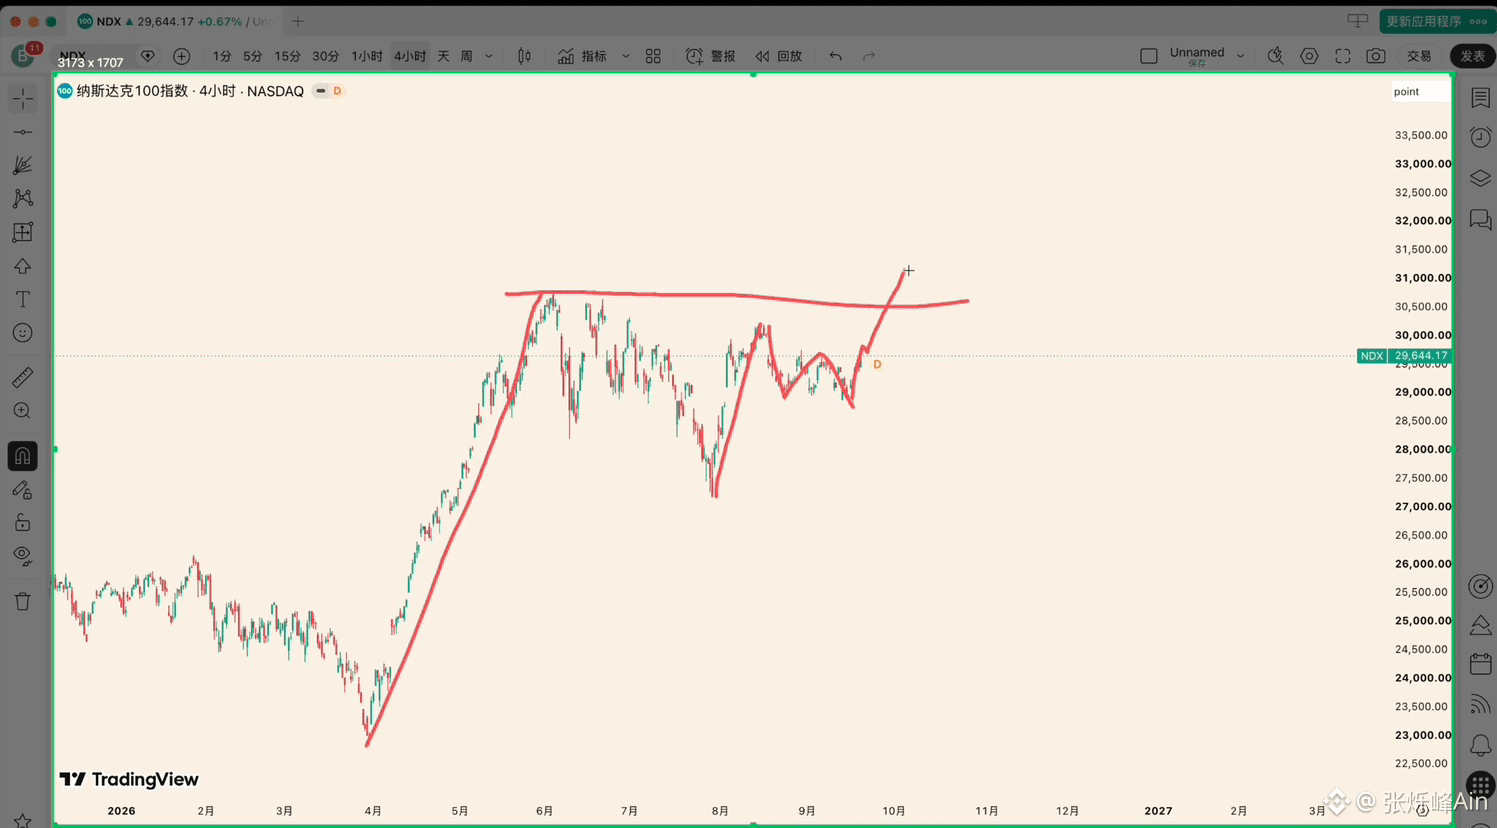
As shown in Figure 1, in the video from September 20 we said that the adjustment for the Nasdaq 100 index (NDX) has ended, and that this week would break to new highs. Only three days have passed, and we have seen new highs with our own eyes ✅
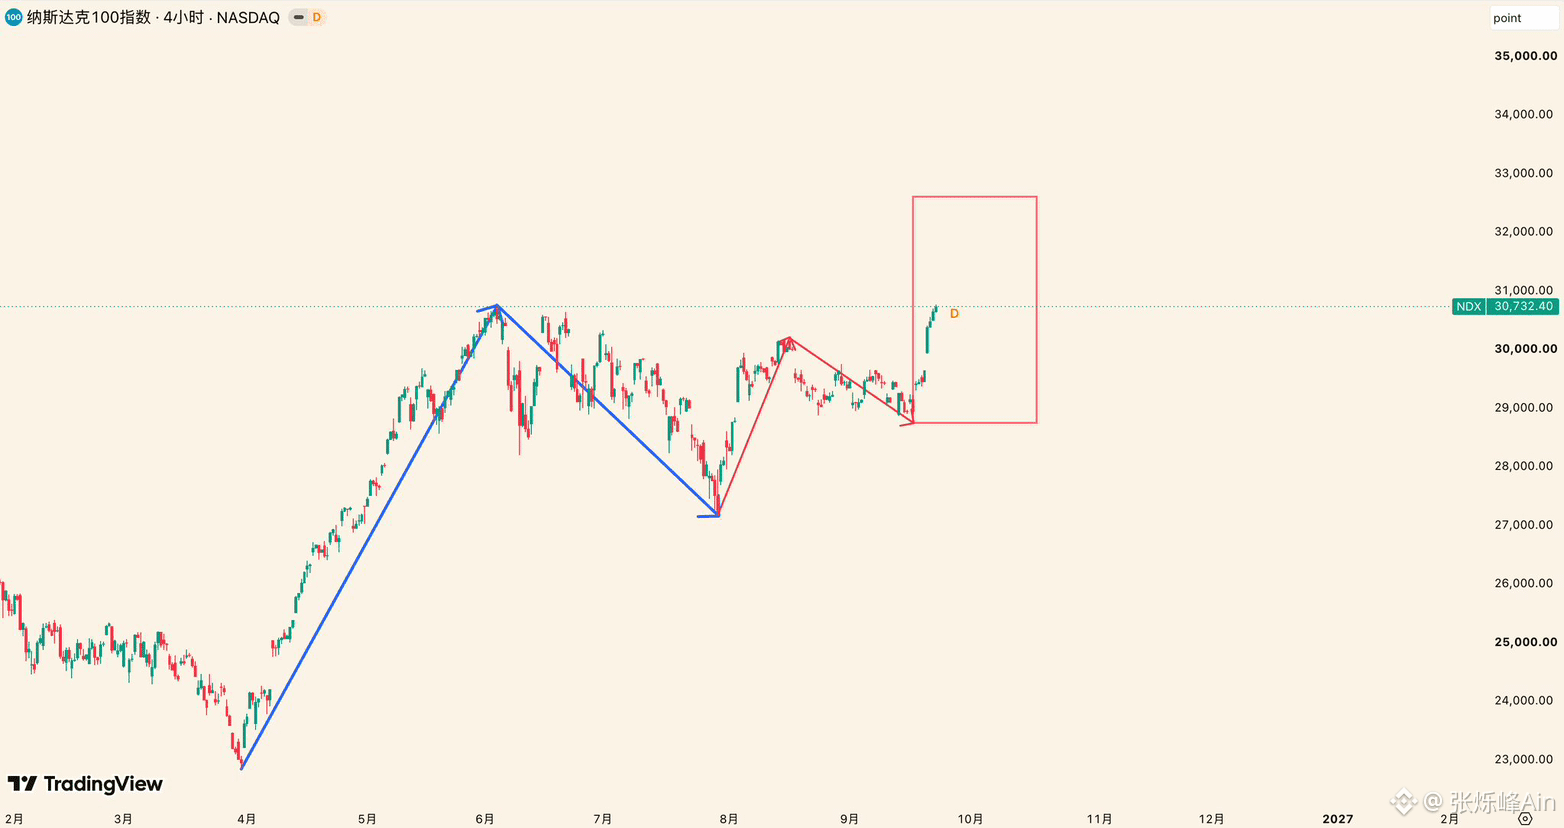
As shown in Figure 2, the blue segment of the Nasdaq in this chart represents a weekly-level uptrend. 30762–27176 is the pullback against it, and the pullback ended on July 30. Along this path, 27176 is the starting point of the next round of the weekly-level uptrend.
On a smaller timeframe, we regard 27176–30195.72 as a daily-level uptrend. 30195.72–28753.29 is the pullback against it, and that pullback has already ended. The uptrend starting from 28753.29 is the same as the move from 27176–30195.72, and it still belongs to the daily-level.
Summary: Whether starting from the weekly timeframe or the daily timeframe, the Nasdaq is in an uptrend. As long as it can stay above 30,000, this rally still has momentum. Only if it breaks below 30,000 will a daily-level pullback begin. After the pullback, it will still continue higher, because the weekly-level uptrend that started from 27176 has not ended yet.
As shown in Figure 2, the blue segment of the Nasdaq in this chart represents a weekly-level uptrend. 30762–27176 is the pullback against it, and the pullback ended on July 30. Along this path, 27176 is the starting point of the next round of the weekly-level uptrend.
On a smaller timeframe, we regard 27176–30195.72 as a daily-level uptrend. 30195.72–28753.29 is the pullback against it, and that pullback has already ended. The uptrend starting from 28753.29 is the same as the move from 27176–30195.72, and it still belongs to the daily-level.
Summary: Whether starting from the weekly timeframe or the daily timeframe, the Nasdaq is in an uptrend. As long as it can stay above 30,000, this rally still has momentum. Only if it breaks below 30,000 will a daily-level pullback begin. After the pullback, it will still continue higher, because the weekly-level uptrend that started from 27176 has not ended yet.