What Is Fibonacci Retracement?
Ever wondered why Bitcoin sometimes pulls back to a certain level, finds support, and then continues its original move?
One tool traders use to identify these potential zones is Fibonacci Retracement.
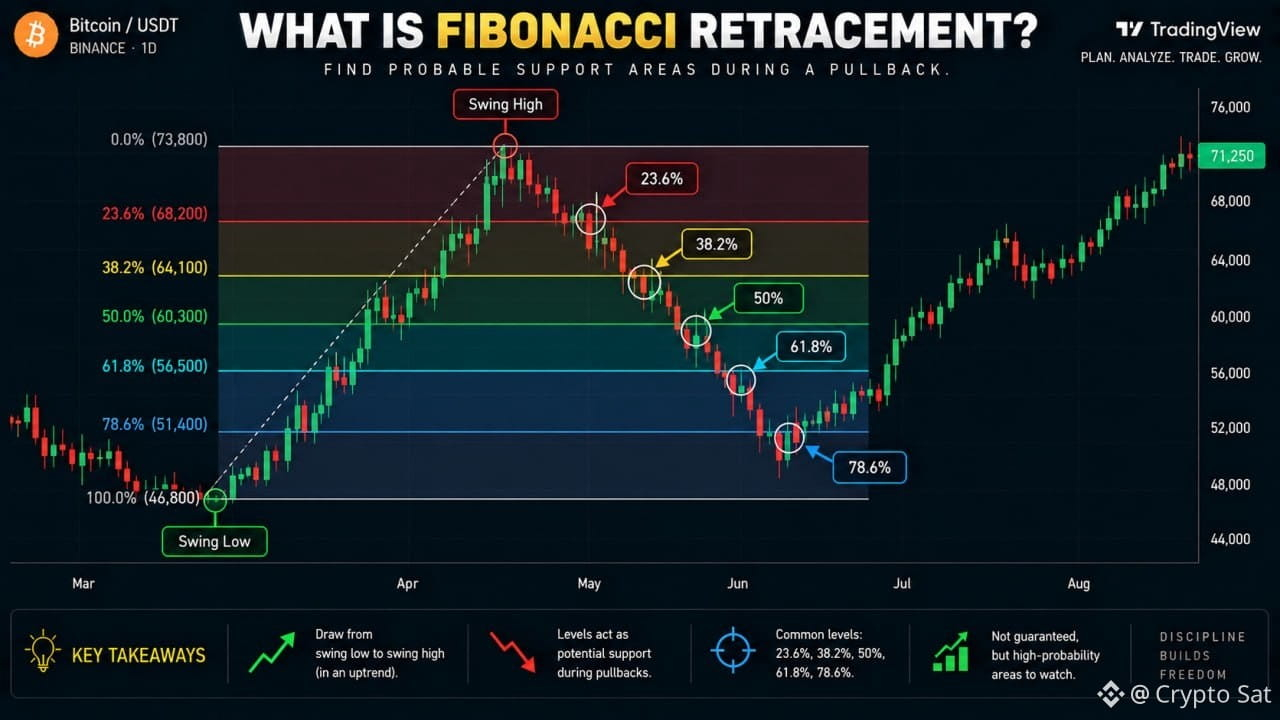
Fibonacci Retracement is a technical analysis tool used to identify potential pullback areas during a price move.
The idea is simple:
• BTC makes a strong move upward
• Price starts pulling back
• Fibonacci levels help traders watch areas where buyers could step in.
🔹 Key Fibonacci Levels
The most commonly watched levels are:
▪️ 23.6% — Shallow pullback
▪️ 38.2% — Moderate pullback
▪️ 50% — Common psychological level
▪️ 61.8% — Major Fibonacci level
▪️ 78.6% — Deeper pullback
For example, if BTC rallies from $80K → $100K, traders may use Fibonacci to identify potential retracement zones between those prices.
These levels don't tell you exactly where price will reverse.
Instead, they give you areas to watch.
🚨 Fibonacci Is NOT a Magic Signal
This is where beginners often make mistakes.
❌ "Price touched 61.8%, so I'm buying."
Not so fast.
Price can break through any Fibonacci level.
Professional traders usually combine Fibonacci with:
▪️ Support & resistance
▪️ Market structure
▪️ Candlestick confirmation
▪️ Volume
▪️ Trend direction
When multiple factors point toward the same area, the setup can become more interesting.
Remember:
Fibonacci helps identify potential zones.
Price action provides the confirmation.
Which level is price respecting?
Don't trade Fibonacci blindly. Use it as a confirmation tool, not a prediction machine. 🚀
Ever wondered why Bitcoin sometimes pulls back to a certain level, finds support, and then continues its original move?
One tool traders use to identify these potential zones is Fibonacci Retracement.
Fibonacci Retracement is a technical analysis tool used to identify potential pullback areas during a price move.
The idea is simple:
• BTC makes a strong move upward
• Price starts pulling back
• Fibonacci levels help traders watch areas where buyers could step in.
🔹 Key Fibonacci Levels
The most commonly watched levels are:
▪️ 23.6% — Shallow pullback
▪️ 38.2% — Moderate pullback
▪️ 50% — Common psychological level
▪️ 61.8% — Major Fibonacci level
▪️ 78.6% — Deeper pullback
For example, if BTC rallies from $80K → $100K, traders may use Fibonacci to identify potential retracement zones between those prices.
These levels don't tell you exactly where price will reverse.
Instead, they give you areas to watch.
🚨 Fibonacci Is NOT a Magic Signal
This is where beginners often make mistakes.
❌ "Price touched 61.8%, so I'm buying."
Not so fast.
Price can break through any Fibonacci level.
Professional traders usually combine Fibonacci with:
▪️ Support & resistance
▪️ Market structure
▪️ Candlestick confirmation
▪️ Volume
▪️ Trend direction
When multiple factors point toward the same area, the setup can become more interesting.
Remember:
Fibonacci helps identify potential zones.
Price action provides the confirmation.
Which level is price respecting?
Don't trade Fibonacci blindly. Use it as a confirmation tool, not a prediction machine. 🚀