$ZEC JUST BROKE $1,600 — BUT THE REAL TEST IS STILL AHEAD
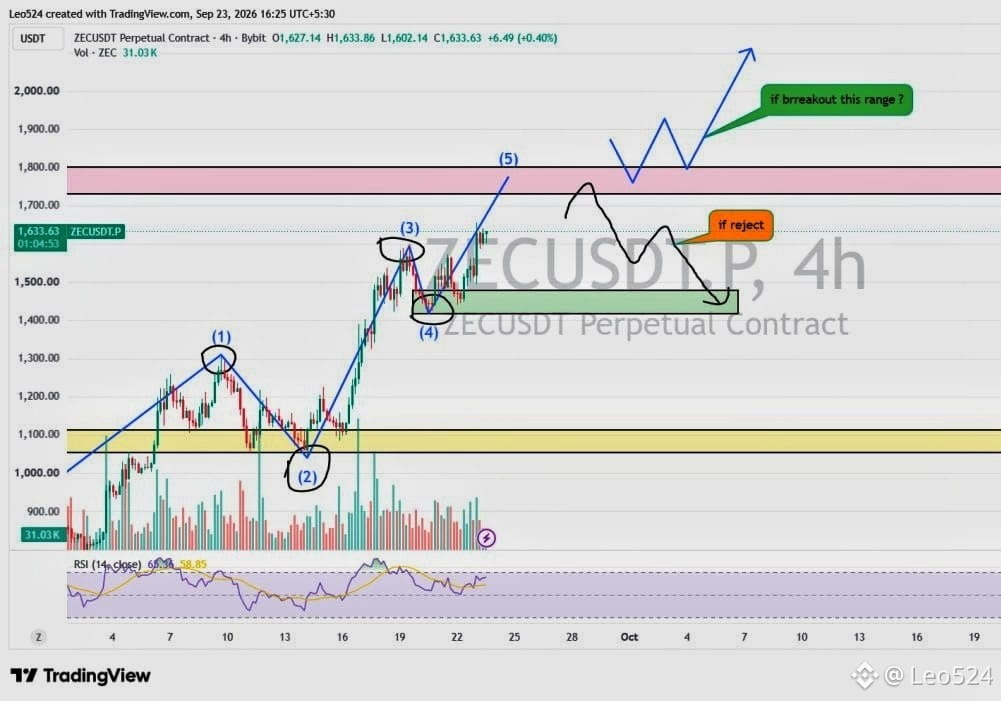
$ZEC has been moving strongly over the last few days. On the 4H chart, we can see a clear impulsive structure, with price pushing higher after holding the $1,420–$1,480 demand area.
The current move has taken ZEC above the previous $1,550–$1,600 high, so the next important area on my chart is $1,730–$1,800.
This is where I’m paying the most attention.
If ZEC breaks this resistance and holds above it, the current bullish structure remains strong and the market can start looking for the next higher liquidity levels.
But if price reaches $1,730–$1,800 and gets rejected, I would not chase the move. The first area I’d watch for a pullback is around $1,420–$1,480, where the previous demand and consolidation are located.
#ZECBreaksAbove$1600AtRecordHigh
$ZEC has been moving strongly over the last few days. On the 4H chart, we can see a clear impulsive structure, with price pushing higher after holding the $1,420–$1,480 demand area.
The current move has taken ZEC above the previous $1,550–$1,600 high, so the next important area on my chart is $1,730–$1,800.
This is where I’m paying the most attention.
If ZEC breaks this resistance and holds above it, the current bullish structure remains strong and the market can start looking for the next higher liquidity levels.
But if price reaches $1,730–$1,800 and gets rejected, I would not chase the move. The first area I’d watch for a pullback is around $1,420–$1,480, where the previous demand and consolidation are located.
#ZECBreaksAbove$1600AtRecordHigh