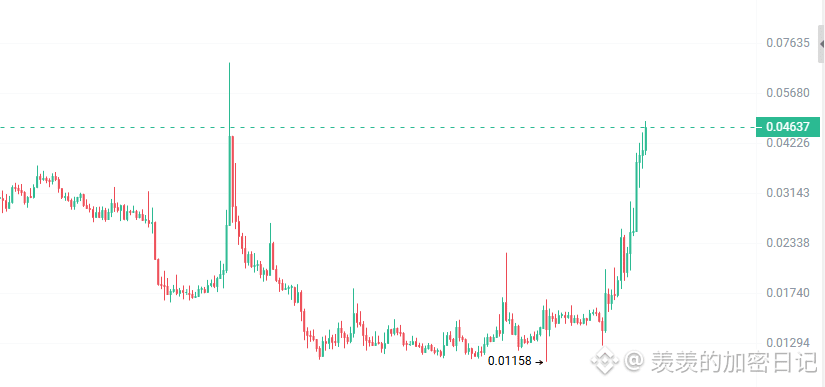
I took a look: $SAGA
, and the daily chart has formed 7 consecutive bullish candles. Previously, $BEAT was also at the market’s topping phase and had shown a similar run of consecutive bullish candles. After that, it went on to deliver a surge of several dozen times.
Now SAGA’s market cap, the chip/holding structure, and the earlier BEAT have similar characteristics. In the low range, it accumulated a lot of positioning. Overall, its K-line trend looks very strong. For projects with this kind of setup, they’re more likely to attract external capital and large buy orders entering the market.
At the moment, the market is still in an early stage and the trading volume hasn’t noticeably expanded yet. Compared with the past, SAGA’s future market performance may have the potential to outperform the earlier BEAT and BTW.
, and the daily chart has formed 7 consecutive bullish candles. Previously, $BEAT was also at the market’s topping phase and had shown a similar run of consecutive bullish candles. After that, it went on to deliver a surge of several dozen times.
Now SAGA’s market cap, the chip/holding structure, and the earlier BEAT have similar characteristics. In the low range, it accumulated a lot of positioning. Overall, its K-line trend looks very strong. For projects with this kind of setup, they’re more likely to attract external capital and large buy orders entering the market.
At the moment, the market is still in an early stage and the trading volume hasn’t noticeably expanded yet. Compared with the past, SAGA’s future market performance may have the potential to outperform the earlier BEAT and BTW.