



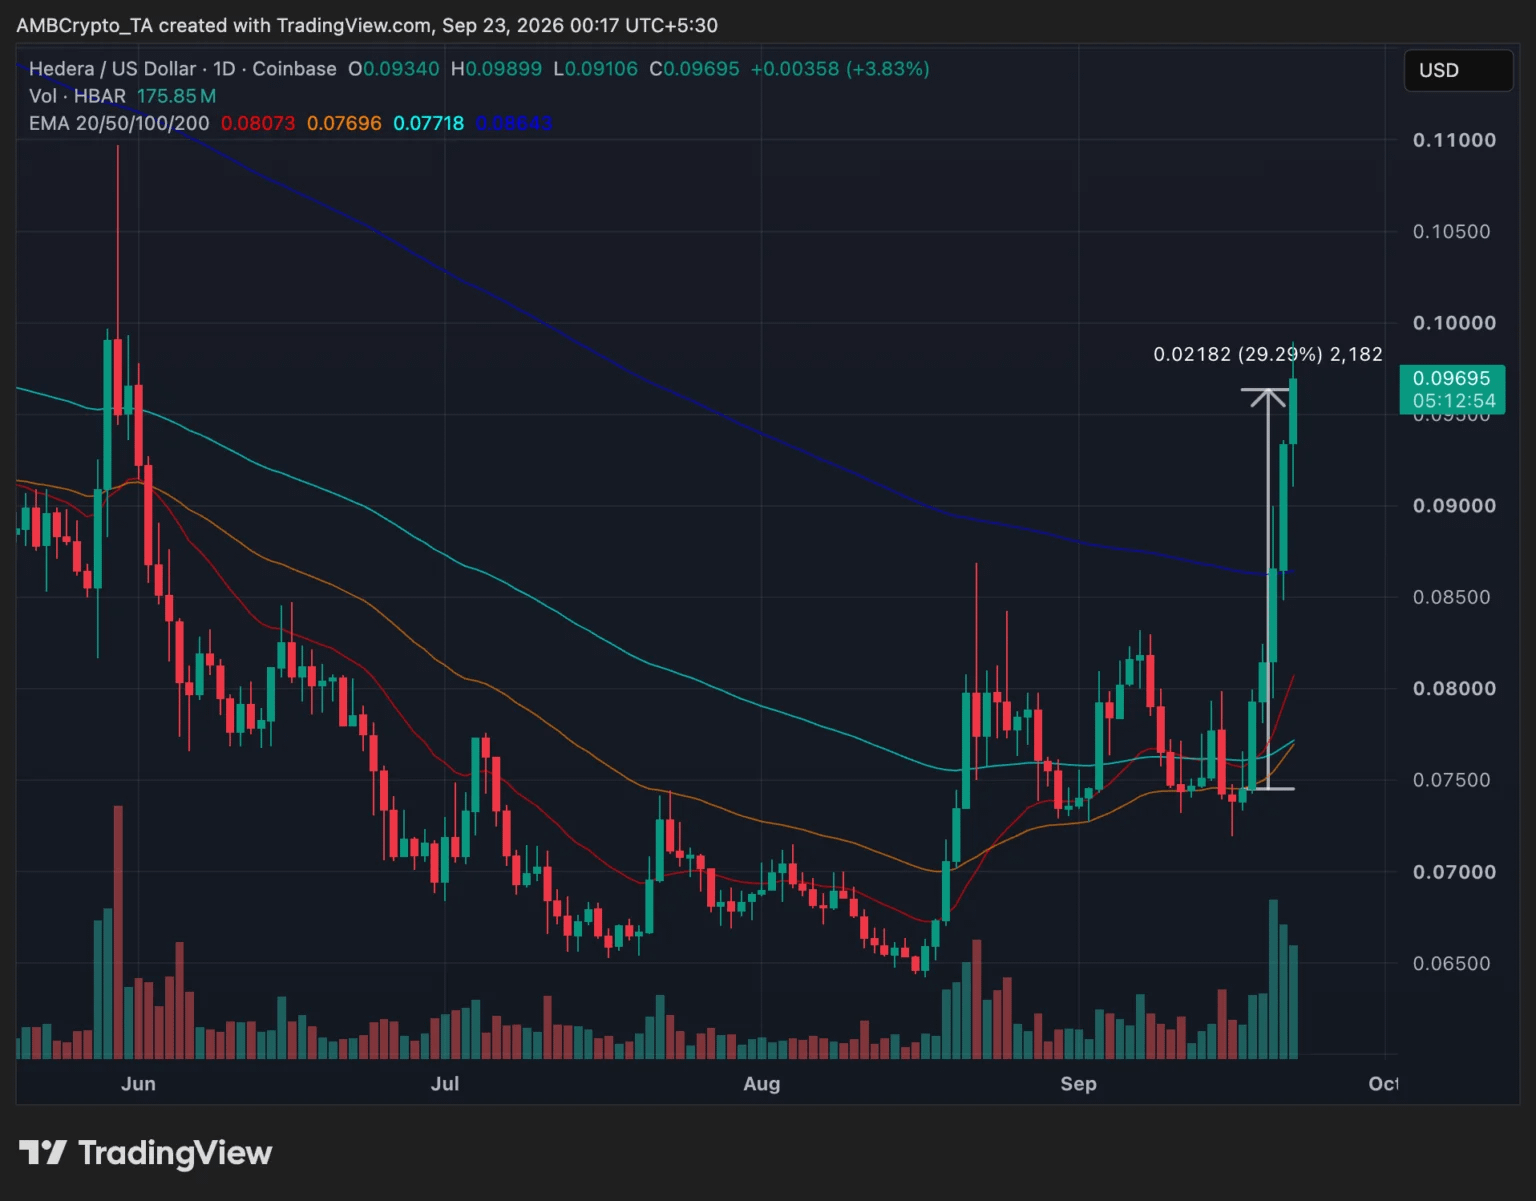
Hedera (HBAR) has recently shown a clear push. The price rebounded steadily from the recent low, gaining nearly 29%, and peaked around $0.099—just one step away from the $0.10 level that everyone is watching.
More importantly, this rally isn’t just a simple minor rebound. HBAR has broken through the $0.086 resistance level that it had been stuck below for months, and trading volume has also increased significantly, indicating rising market participation.
Key breakthrough: $0.086
In short, $0.086 is a very important watershed level for HBAR in the recent period.
Previously, HBAR had been oscillating repeatedly around this area for a long time, with the price repeatedly suppressed. Now the price has reclaimed above $0.086, and it’s also trading above the 200-day moving average, suggesting improvements in both short-term and medium-to-long-term trends.
At the same time, HBAR’s short-term moving averages are also positioned below the price. For beginners, you can simply understand it this way: the current price is already above several important reference lines, and the market’s short-term momentum is clearly strong.
Also worth paying attention to is that this upswing comes with rising trading volume. In general, when price rises and volume increases at the same time, it indicates higher participation from both buyers and sellers, making the breakout more meaningful.
$0.10 is the real big test.
Even though HBAR has already surged to around $0.099, the real resistance is still at $0.10.
This level hasn’t seen a strong close for a long time. If HBAR can break out with increased volume and stabilize above $0.10 on the daily chart, then the market’s next focus may be the $0.109–$0.11 area.
However, note that $0.109–$0.11 previously saw fairly noticeable selling. So even if HBAR breaks above $0.10, it doesn’t necessarily mean it will keep rising all the way; when it approaches this zone, sell pressure may show up again.
What if it can’t break through?
If HBAR repeatedly attempts to push through $0.10 and fails, then the short-term market may enter a consolidation range, or even see a pullback.
In that case, first look at $0.09. If after a pullback it can hold above $0.09, it indicates that the bulls still have some support.
Going further down is the more critical $0.086. This level is not only a prior key resistance, but it has also become the support that needs to be watched now.
Beginners should remember this: $0.10 is the breakout level, $0.09 is the support level, and $0.086 is the more important defensive level.
As long as HBAR can hold above $0.086, there is still room for further development in this breakout. If it falls back below $0.086, it would suggest this rally may see a pullback, and the risk of chasing highs in the short term would increase significantly.