As early as May, when $ETH was still in a downward trend, we identified the downside end at 1500. After that, ETH fell to 1505. By the end of June, we indicated that as long as 1505 was not broken, the downtrend would be basically confirmed to have ended. As of early yesterday morning, ETH’s gain had already reached 86%+. Even friends who just bought in last week are now in profit. So how should we look at the upcoming market?
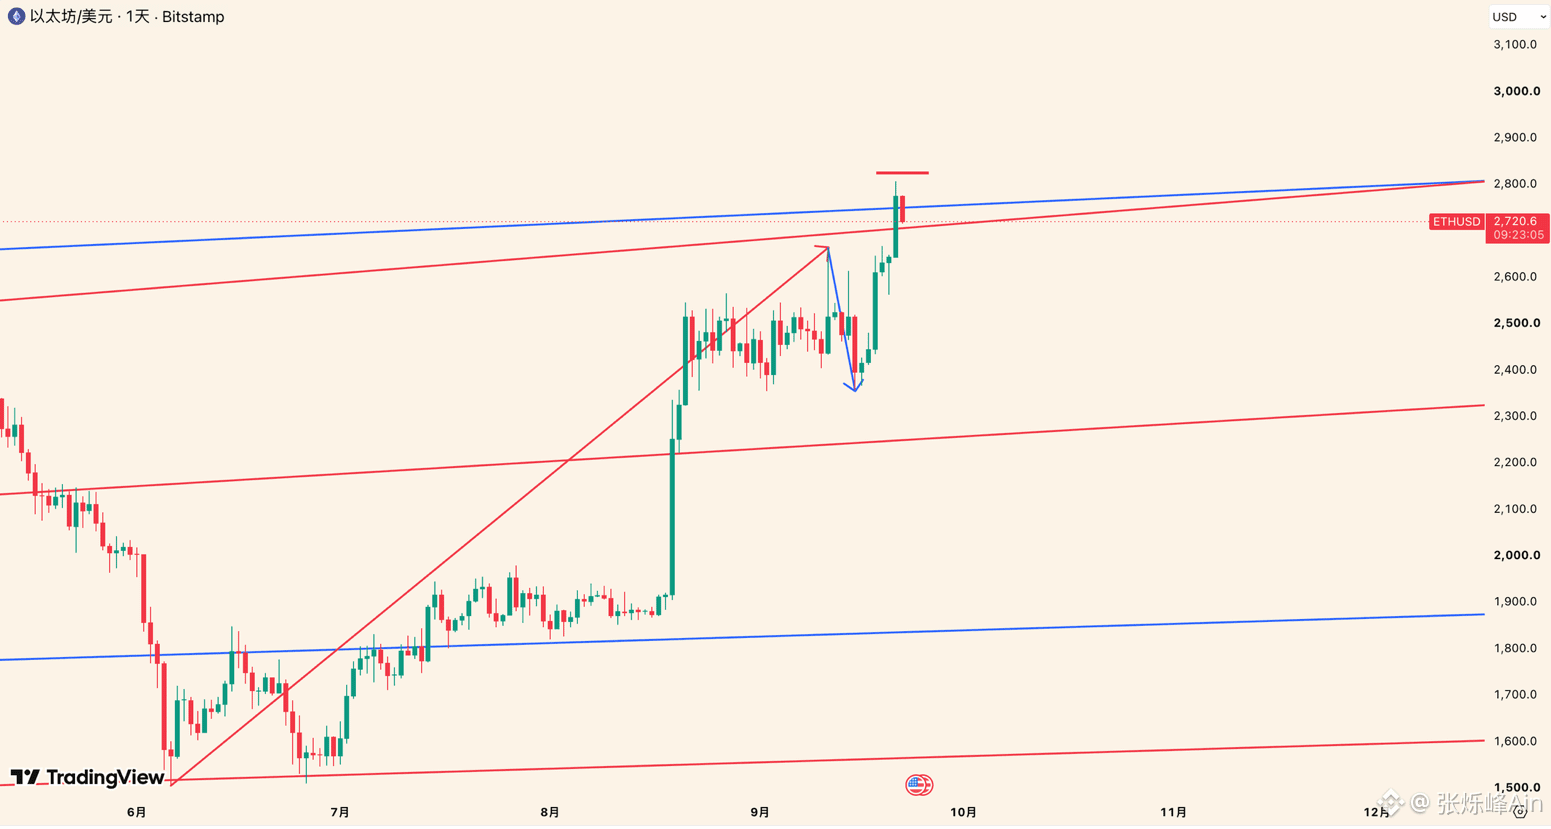
As shown in Figure 1, the red segment of $ETH represents an uptrend at the daily timeframe level, while the blue segment is a retracement against it. Along this path, 2357 serves as the retracement endpoint. From that point onward, the next move is an uptrend at the same level as the red segment.
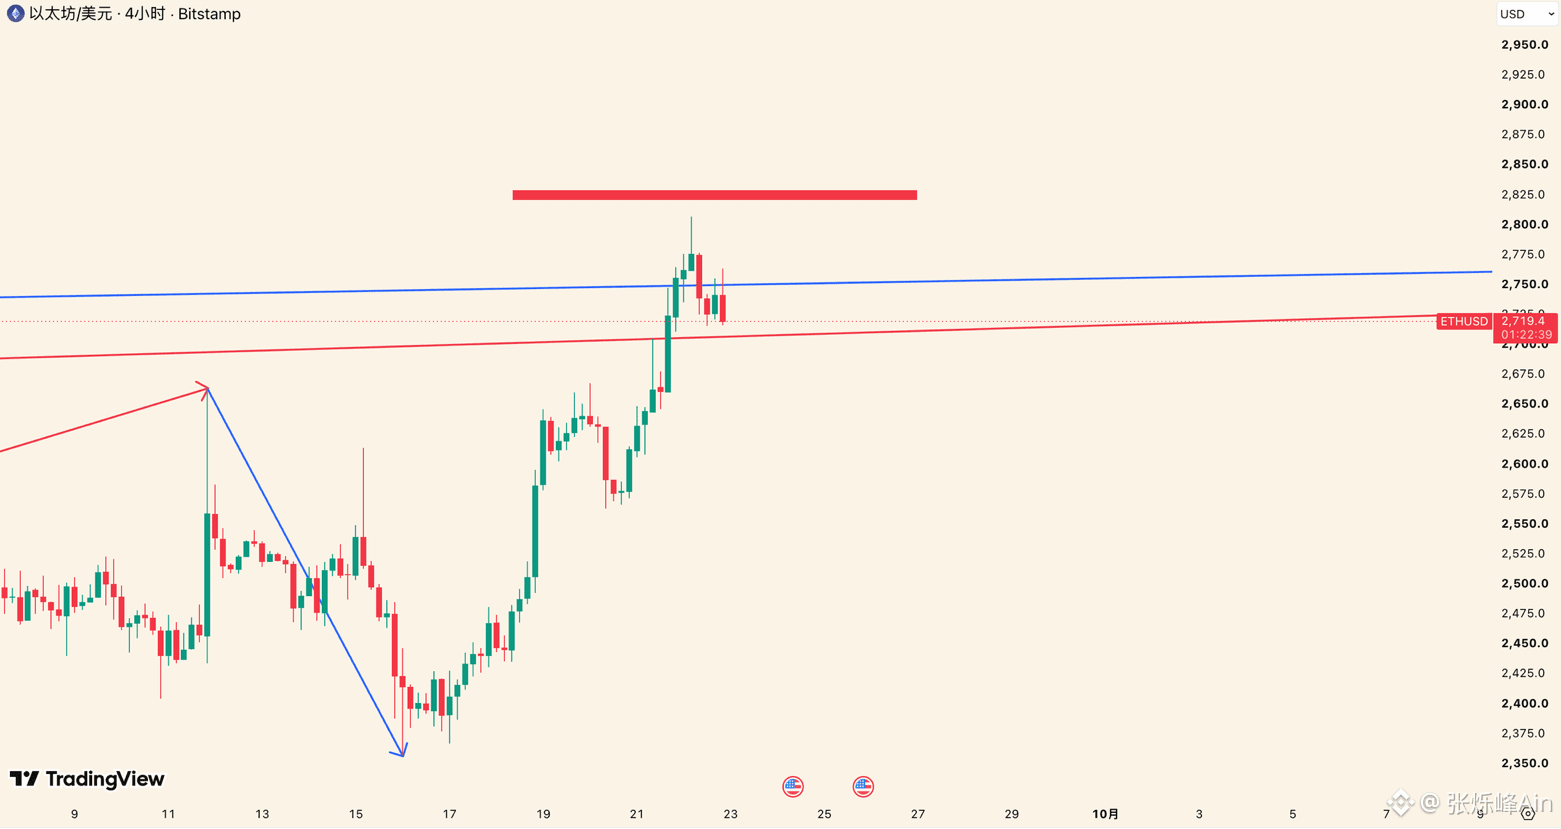
As shown in Figure 2, after ETH broke through our first target zone of 2720–2750 in the early morning, it rose to a high of 2807. Now it has pulled back to around 2720. We will observe whether this level can act as support. As long as the daily candlestick body does not fall below 2706, the decline from 2807 is merely a retracement within the ongoing uptrend—and it is a strong retracement. Along this path, there is still upward momentum.
The observation point below 2706 is at 2635. If this level breaks, it proves that this retracement is targeting the entire uptrend that began from 2357. After finding the retracement endpoint, the price will continue to rise. #eth $ETH
As shown in Figure 1, the red segment of $ETH represents an uptrend at the daily timeframe level, while the blue segment is a retracement against it. Along this path, 2357 serves as the retracement endpoint. From that point onward, the next move is an uptrend at the same level as the red segment.
As shown in Figure 2, after ETH broke through our first target zone of 2720–2750 in the early morning, it rose to a high of 2807. Now it has pulled back to around 2720. We will observe whether this level can act as support. As long as the daily candlestick body does not fall below 2706, the decline from 2807 is merely a retracement within the ongoing uptrend—and it is a strong retracement. Along this path, there is still upward momentum.
The observation point below 2706 is at 2635. If this level breaks, it proves that this retracement is targeting the entire uptrend that began from 2357. After finding the retracement endpoint, the price will continue to rise. #eth $ETH