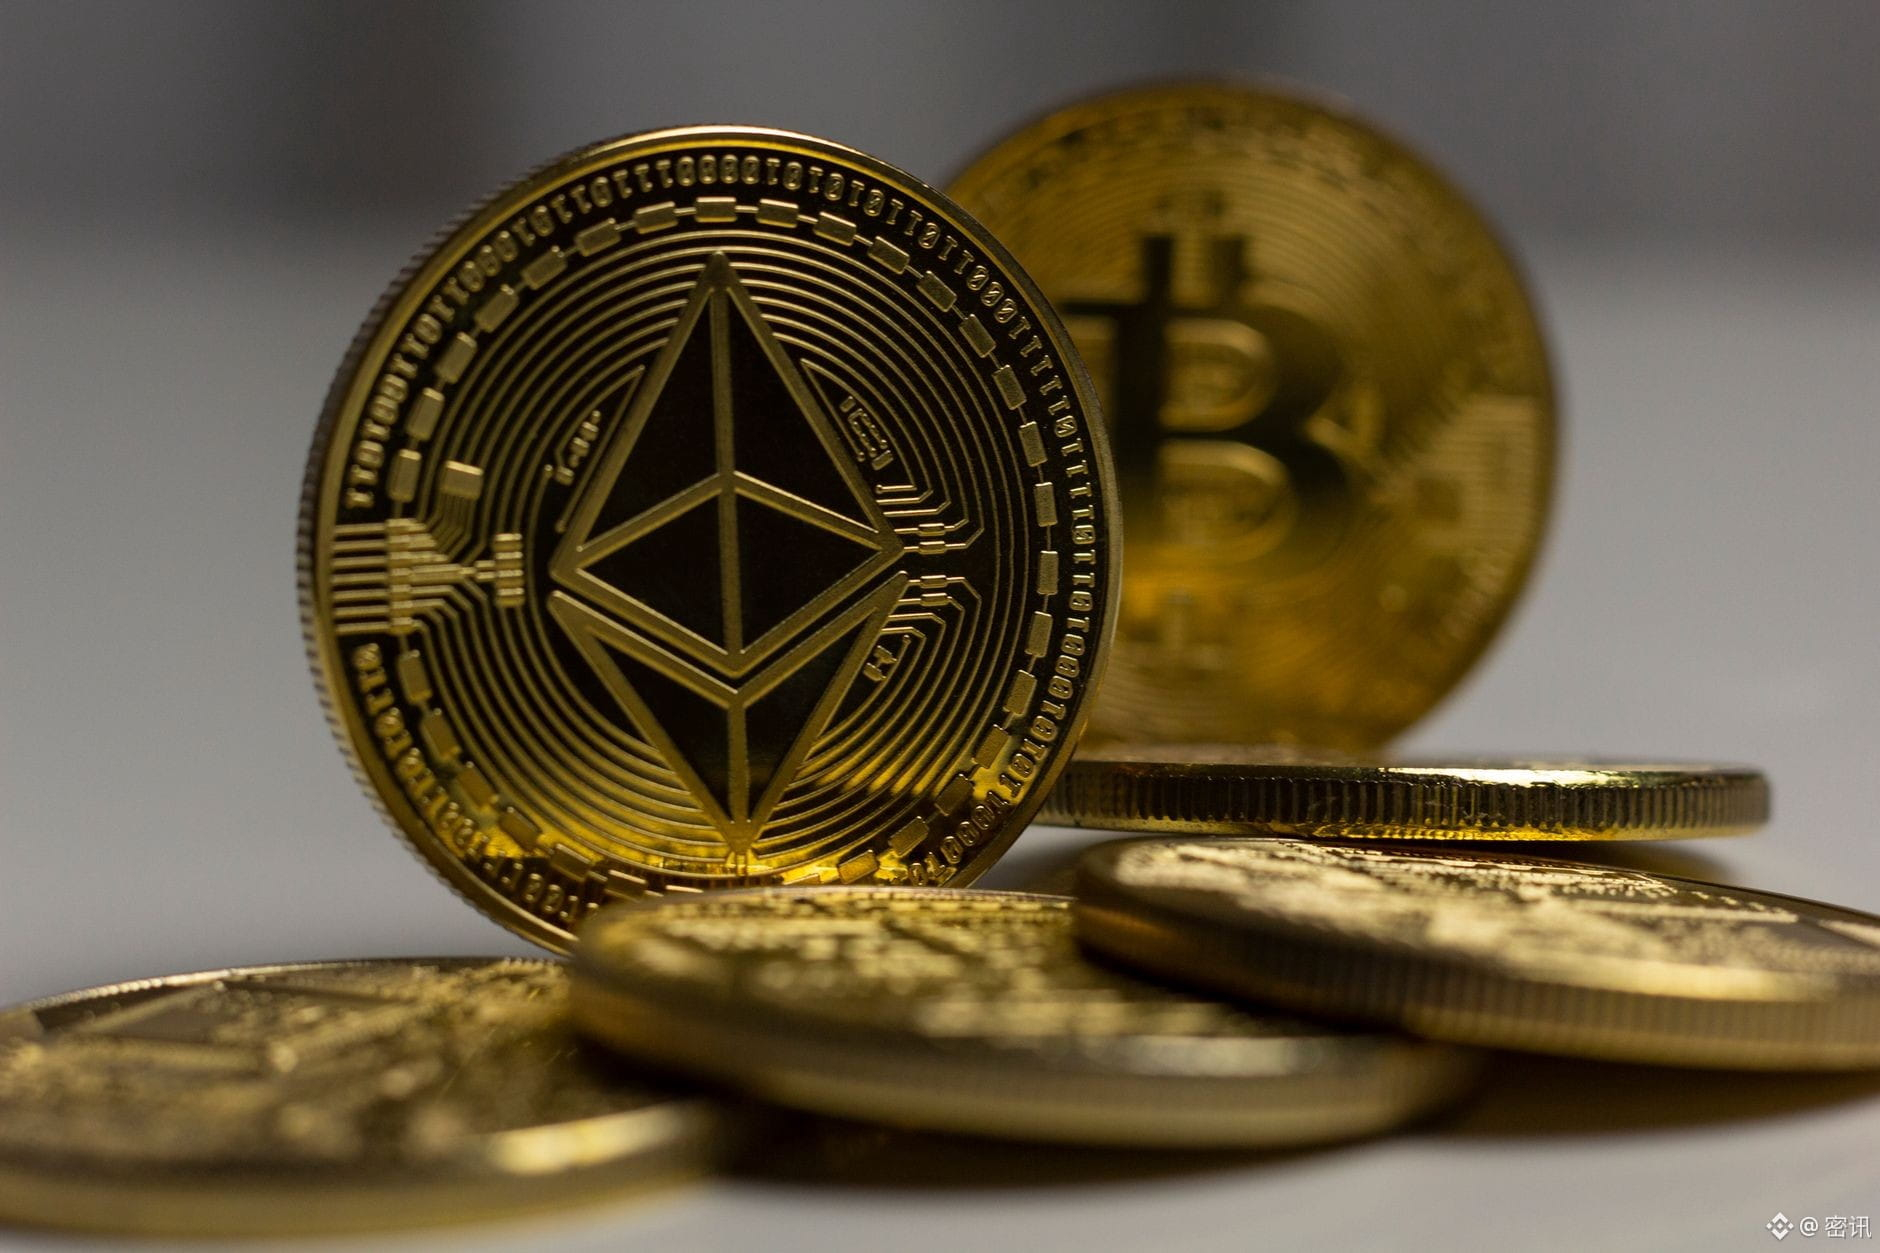
Repricing Ethereum Under Macro Tightening: Shifting from a High-Beta to an Independent Economic Engine
Against the dual backdrop of ongoing macro liquidity tightening and a restructuring of risk-asset pricing logic, Ethereum’s (ETH) market role is undergoing a profound paradigm shift. As the absolute leader among smart-contract blockchains, its valuation framework no longer depends solely on periodic inflows of speculative capital; instead, it is deeply anchored to the quality of real on-chain economic activity and the degree to which institutional-grade infrastructure has been adopted. For market participants, ETH’s pricing anchor is being difficultly shifted from a “high-beta asset tied to Bitcoin” toward an “economic engine capable of capturing independent value.” The core tension in this process is whether on-chain activity levels and the resulting burn demand are sufficient to support its premium versus Bitcoin; and whether, before and after the emergence of standardized trading tools such as spot Ethereum ETFs, the market has made a substantive repricing of the supply-demand structure. At present, attention has shifted from mere price-volatility metrics to underlying network health indicators, including block utilization rates, the number of active validators, and the actual usage frequency of on-chain applications. This transition from sentiment-driven to fundamentals-driven requires investors, when interpreting any market signals about Ethereum, to strip away short-term noise and get to the essence of the data—so as to determine whether ETH has endogenous growth momentum capable of carrying through the cycle.
In a normal operating cycle with no specific sudden news or extreme data fluctuations, Ethereum’s valuation logic largely revolves around the dynamic adjustment of Gas fees under the EIP-1559 mechanism. On-chain activity mainly manifests as transfers, decentralized exchange (DEX) trading, NFT minting, and DeFi lending/borrowing. The key variable behind these behaviors is users’ willingness to pay—i.e., how much ETH they are willing to spend for computing resources—which directly determines the burn demand for ETH. Meanwhile, spot Ethereum ETFs, as a bridge between traditional finance and on-chain assets, are viewed through their trading volume and changes in holdings as key indicators of institutional recognition of Ethereum’s long-term value. However, it is crucial to remain clear-eyed: any discussion of Ethereum, absent specific on-chain data support or clear evidence of capital flows, often stays at the level of opinions rather than facts. Current market consensus is that “on-chain activity” is the core variable for assessing Ethereum’s current state; but interpreting this variable must be grounded in rigorous data analysis rather than vague sentiment expectations. In the absence of concrete tailwind data or major protocol upgrade details, it is illogical to blindly assume that higher on-chain activity will inevitably push prices up. Investors must watch out for the trap of “high activity but low willingness to pay,” as well as the volatility-amplifying effect caused by short-term institutional capital games.
From a microstructure and risk-preference perspective, the strength or weakness of Ethereum’s on-chain activity directly determines its relative appeal within a risk-asset portfolio, but this relationship is not a simple linear positive correlation. When on-chain activity is sluggish and Gas fees are low, it implies insufficient network usage; the amount of ETH burned decreases and, in certain scenarios, an issuance effect may even occur. In supply-demand terms, this is a negative factor that suppresses the downside risk in the ETH/BTC exchange rate. Conversely, if on-chain activity surges—especially driven by DeFi innovation or high-frequency trading demand from L2 scaling—it will push Gas fees higher, increase the amount of ETH burned, and thereby support the price under a deflationary model. The key, however, is to identify the nature of this on-chain activity: is it driven by sustained demand from “real users,” or by “arbitrage bots” or “wash-volume” behaviors? If on-chain activity is mainly driven by low-value arbitrage trades, its price-supporting effect for ETH will be greatly weakened, because such activity does not create sustained pay-demand and is easily erased quickly when market sentiment reverses. In addition, the introduction of ETFs changes the marginal buyer profile for ETH. Institutional capital tends to focus on compliance and liquidity rather than purely on-chain technical details, which may lead to a temporary decoupling between price and on-chain fundamentals. Therefore, in the absence of specific tailwind data, investors cannot be blindly optimistic that on-chain activity will necessarily translate into higher prices. They must watch out for the trap of “high activity but low willingness to pay,” as well as the volatility-amplifying effect caused by short-term institutional capital games.
The next focal points should center on quantitative indicators across two core dimensions to build a more rigorous analytical framework. First is the quality and persistence of on-chain economic activity, specifically including the number of daily unique active addresses (DApp Users), the stability of total value locked (TVL), and the mean-reversion trend of Gas fees. In particular, it is important to distinguish between activity distribution on the mainnet versus on L2 chains, to assess Ethereum’s ability to capture final value as the settlement layer—so as to avoid misjudging low-value L2 “wash volume” as high-value mainnet activity. Second is the microstructure of institutional capital flows: closely track net inflow/outflow data for spot Ethereum ETFs and changes in their holdings, and determine whether these funds exhibit long-term allocation characteristics or short-term trading characteristics. At the same time, closely monitor the upgrade progress of major protocols within the Ethereum ecosystem and how they affect on-chain activity. For example, any upgrade that may change Gas calculation methods or validator incentive mechanisms will directly disrupt the current valuation model. In addition, Bitcoin’s macro liquidity environment remains an important backdrop for Ethereum pricing. If macro liquidity tightens, Ethereum as a high-beta asset often faces heavier selling pressure; at that point, the support from on-chain activity could be overwhelmed by macro factors. Therefore, traders should avoid viewing Ethereum’s on-chain data in isolation; they should place it within a broader framework that considers crypto-market liquidity and macro rate expectations. Beware of decision-making being misled by a single indicator, and thereby maintain rational judgment in a complex and ever-changing market environment.
Follow me—my next post is a fast screen-read so you won’t miss what’s on the market.
Against the dual backdrop of ongoing macro liquidity tightening and a restructuring of risk-asset pricing logic, Ethereum’s (ETH) market role is undergoing a profound paradigm shift. As the absolute leader among smart-contract blockchains, its valuation framework no longer depends solely on periodic inflows of speculative capital; instead, it is deeply anchored to the quality of real on-chain economic activity and the degree to which institutional-grade infrastructure has been adopted. For market participants, ETH’s pricing anchor is being difficultly shifted from a “high-beta asset tied to Bitcoin” toward an “economic engine capable of capturing independent value.” The core tension in this process is whether on-chain activity levels and the resulting burn demand are sufficient to support its premium versus Bitcoin; and whether, before and after the emergence of standardized trading tools such as spot Ethereum ETFs, the market has made a substantive repricing of the supply-demand structure. At present, attention has shifted from mere price-volatility metrics to underlying network health indicators, including block utilization rates, the number of active validators, and the actual usage frequency of on-chain applications. This transition from sentiment-driven to fundamentals-driven requires investors, when interpreting any market signals about Ethereum, to strip away short-term noise and get to the essence of the data—so as to determine whether ETH has endogenous growth momentum capable of carrying through the cycle.
In a normal operating cycle with no specific sudden news or extreme data fluctuations, Ethereum’s valuation logic largely revolves around the dynamic adjustment of Gas fees under the EIP-1559 mechanism. On-chain activity mainly manifests as transfers, decentralized exchange (DEX) trading, NFT minting, and DeFi lending/borrowing. The key variable behind these behaviors is users’ willingness to pay—i.e., how much ETH they are willing to spend for computing resources—which directly determines the burn demand for ETH. Meanwhile, spot Ethereum ETFs, as a bridge between traditional finance and on-chain assets, are viewed through their trading volume and changes in holdings as key indicators of institutional recognition of Ethereum’s long-term value. However, it is crucial to remain clear-eyed: any discussion of Ethereum, absent specific on-chain data support or clear evidence of capital flows, often stays at the level of opinions rather than facts. Current market consensus is that “on-chain activity” is the core variable for assessing Ethereum’s current state; but interpreting this variable must be grounded in rigorous data analysis rather than vague sentiment expectations. In the absence of concrete tailwind data or major protocol upgrade details, it is illogical to blindly assume that higher on-chain activity will inevitably push prices up. Investors must watch out for the trap of “high activity but low willingness to pay,” as well as the volatility-amplifying effect caused by short-term institutional capital games.
From a microstructure and risk-preference perspective, the strength or weakness of Ethereum’s on-chain activity directly determines its relative appeal within a risk-asset portfolio, but this relationship is not a simple linear positive correlation. When on-chain activity is sluggish and Gas fees are low, it implies insufficient network usage; the amount of ETH burned decreases and, in certain scenarios, an issuance effect may even occur. In supply-demand terms, this is a negative factor that suppresses the downside risk in the ETH/BTC exchange rate. Conversely, if on-chain activity surges—especially driven by DeFi innovation or high-frequency trading demand from L2 scaling—it will push Gas fees higher, increase the amount of ETH burned, and thereby support the price under a deflationary model. The key, however, is to identify the nature of this on-chain activity: is it driven by sustained demand from “real users,” or by “arbitrage bots” or “wash-volume” behaviors? If on-chain activity is mainly driven by low-value arbitrage trades, its price-supporting effect for ETH will be greatly weakened, because such activity does not create sustained pay-demand and is easily erased quickly when market sentiment reverses. In addition, the introduction of ETFs changes the marginal buyer profile for ETH. Institutional capital tends to focus on compliance and liquidity rather than purely on-chain technical details, which may lead to a temporary decoupling between price and on-chain fundamentals. Therefore, in the absence of specific tailwind data, investors cannot be blindly optimistic that on-chain activity will necessarily translate into higher prices. They must watch out for the trap of “high activity but low willingness to pay,” as well as the volatility-amplifying effect caused by short-term institutional capital games.
The next focal points should center on quantitative indicators across two core dimensions to build a more rigorous analytical framework. First is the quality and persistence of on-chain economic activity, specifically including the number of daily unique active addresses (DApp Users), the stability of total value locked (TVL), and the mean-reversion trend of Gas fees. In particular, it is important to distinguish between activity distribution on the mainnet versus on L2 chains, to assess Ethereum’s ability to capture final value as the settlement layer—so as to avoid misjudging low-value L2 “wash volume” as high-value mainnet activity. Second is the microstructure of institutional capital flows: closely track net inflow/outflow data for spot Ethereum ETFs and changes in their holdings, and determine whether these funds exhibit long-term allocation characteristics or short-term trading characteristics. At the same time, closely monitor the upgrade progress of major protocols within the Ethereum ecosystem and how they affect on-chain activity. For example, any upgrade that may change Gas calculation methods or validator incentive mechanisms will directly disrupt the current valuation model. In addition, Bitcoin’s macro liquidity environment remains an important backdrop for Ethereum pricing. If macro liquidity tightens, Ethereum as a high-beta asset often faces heavier selling pressure; at that point, the support from on-chain activity could be overwhelmed by macro factors. Therefore, traders should avoid viewing Ethereum’s on-chain data in isolation; they should place it within a broader framework that considers crypto-market liquidity and macro rate expectations. Beware of decision-making being misled by a single indicator, and thereby maintain rational judgment in a complex and ever-changing market environment.
Follow me—my next post is a fast screen-read so you won’t miss what’s on the market.