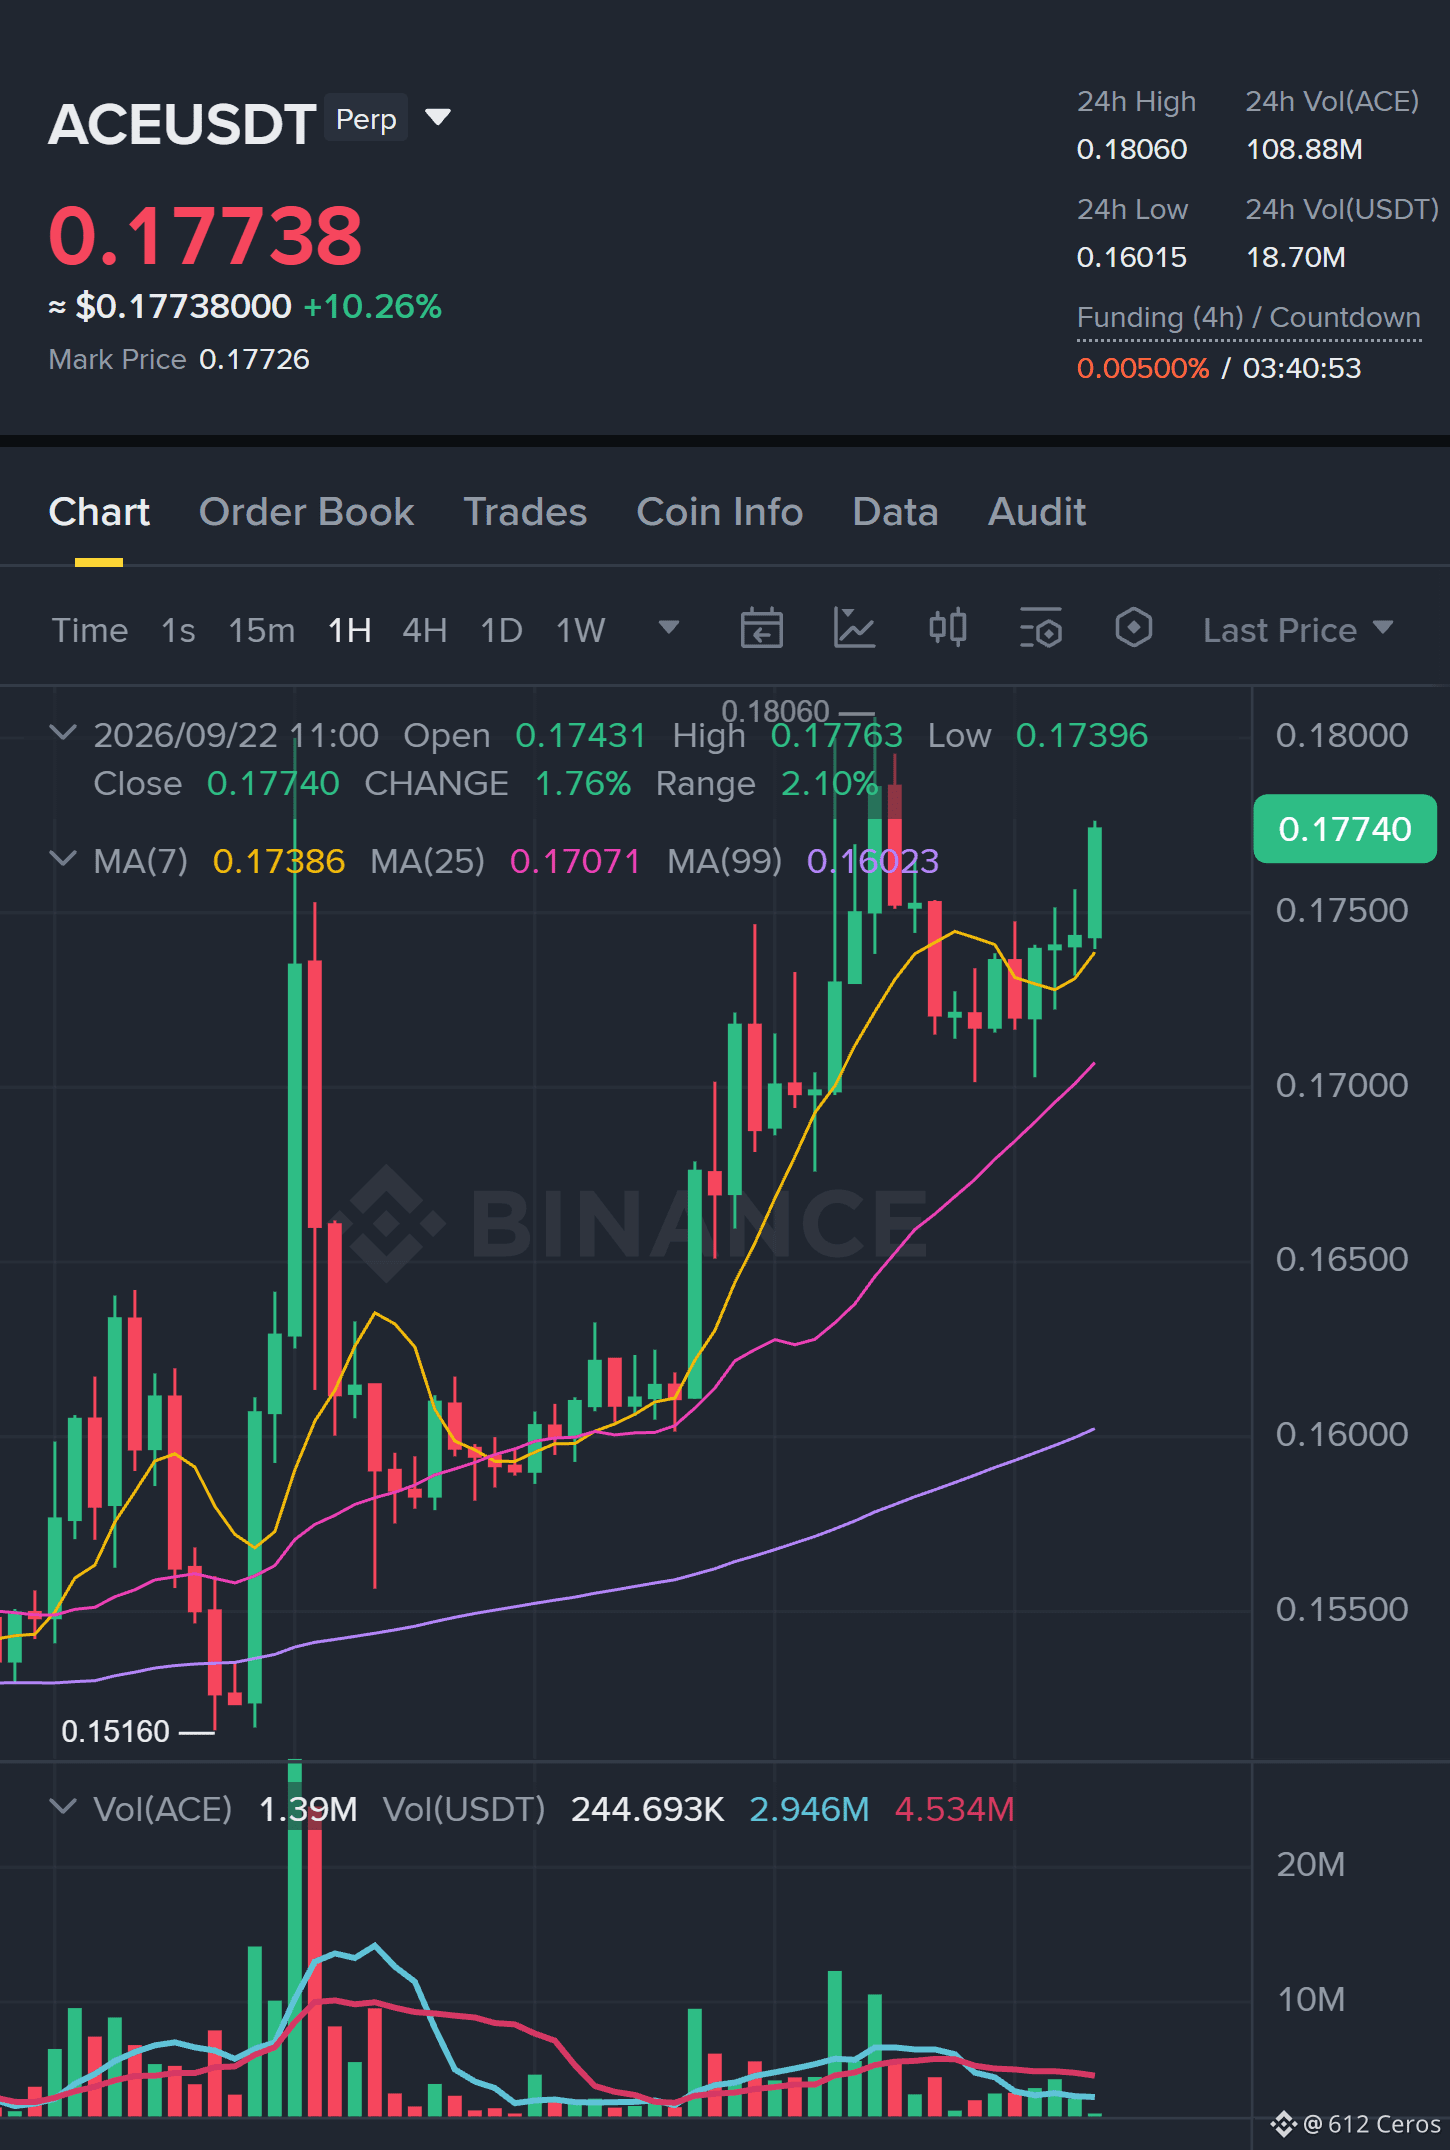
ACE has held the daily bullish stack for the third consecutive session.
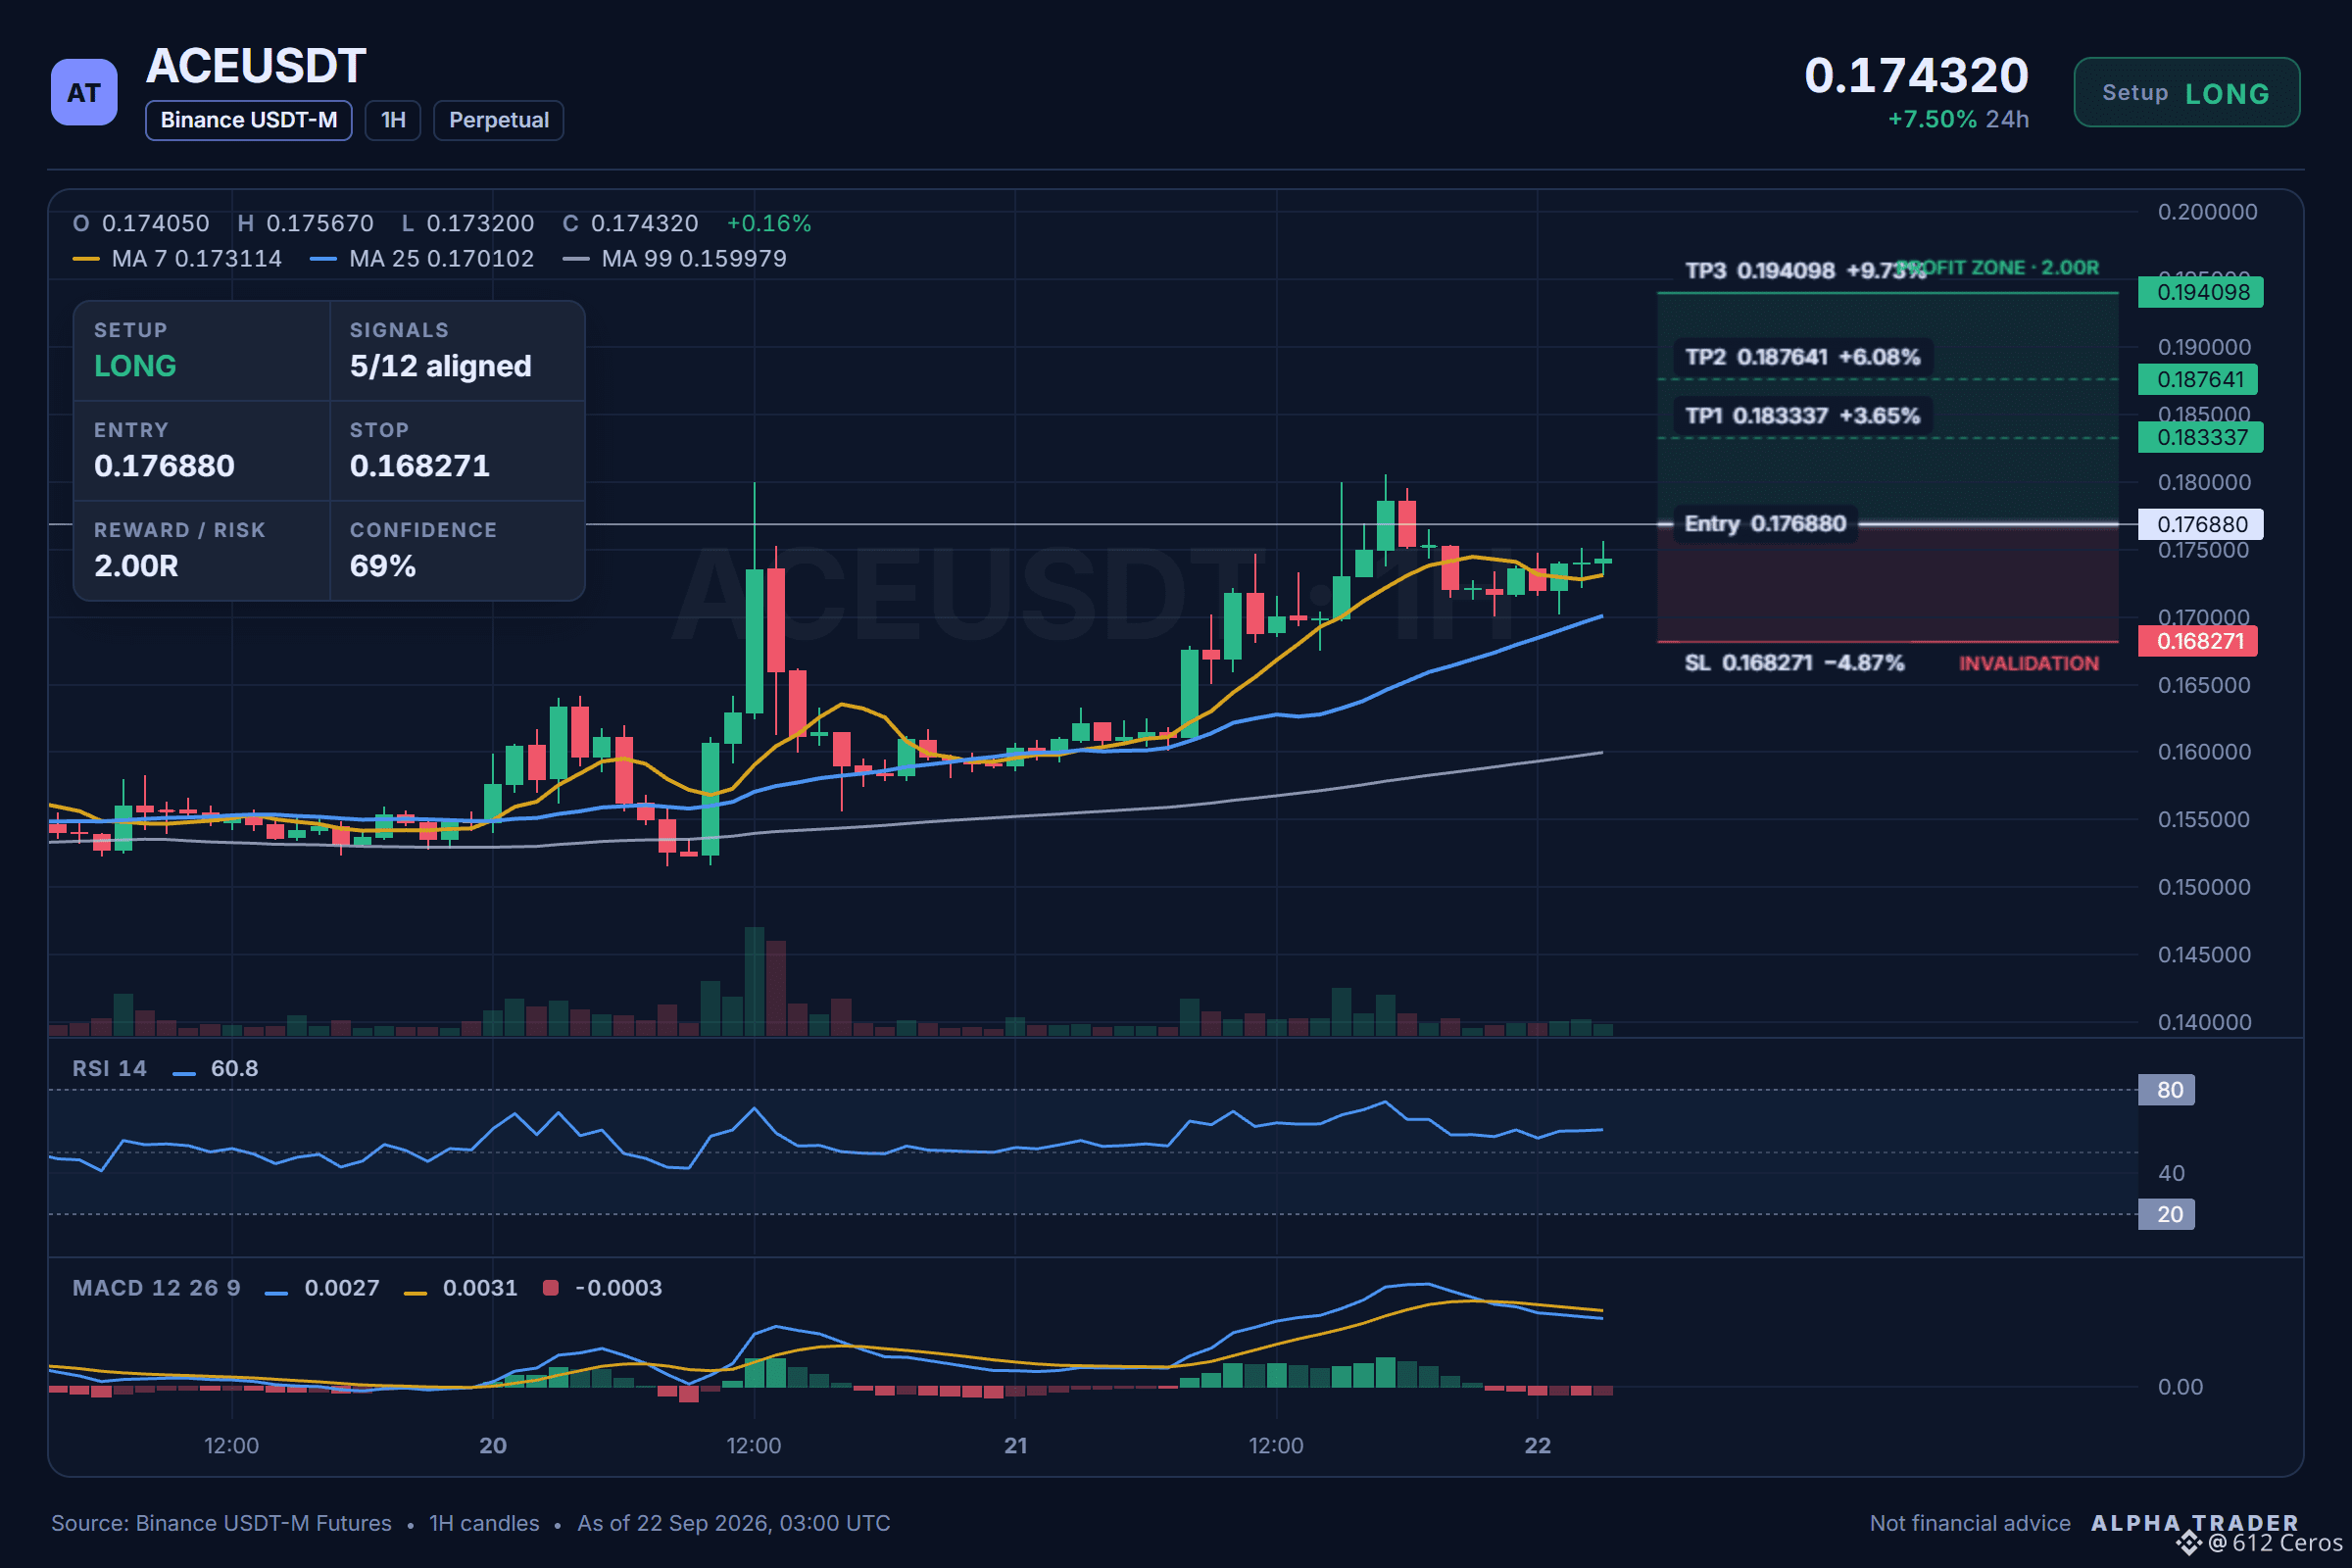
🟢 $ACE /USDT | Bias: LONG (Leaning) | 5/12 signals aligned
⚠️ Leaning only: 7 of 12 signals are still undecided. Keep size light.
Technical verdict: LEANING LONG. 5 of 12 signals aligned, 0 against.
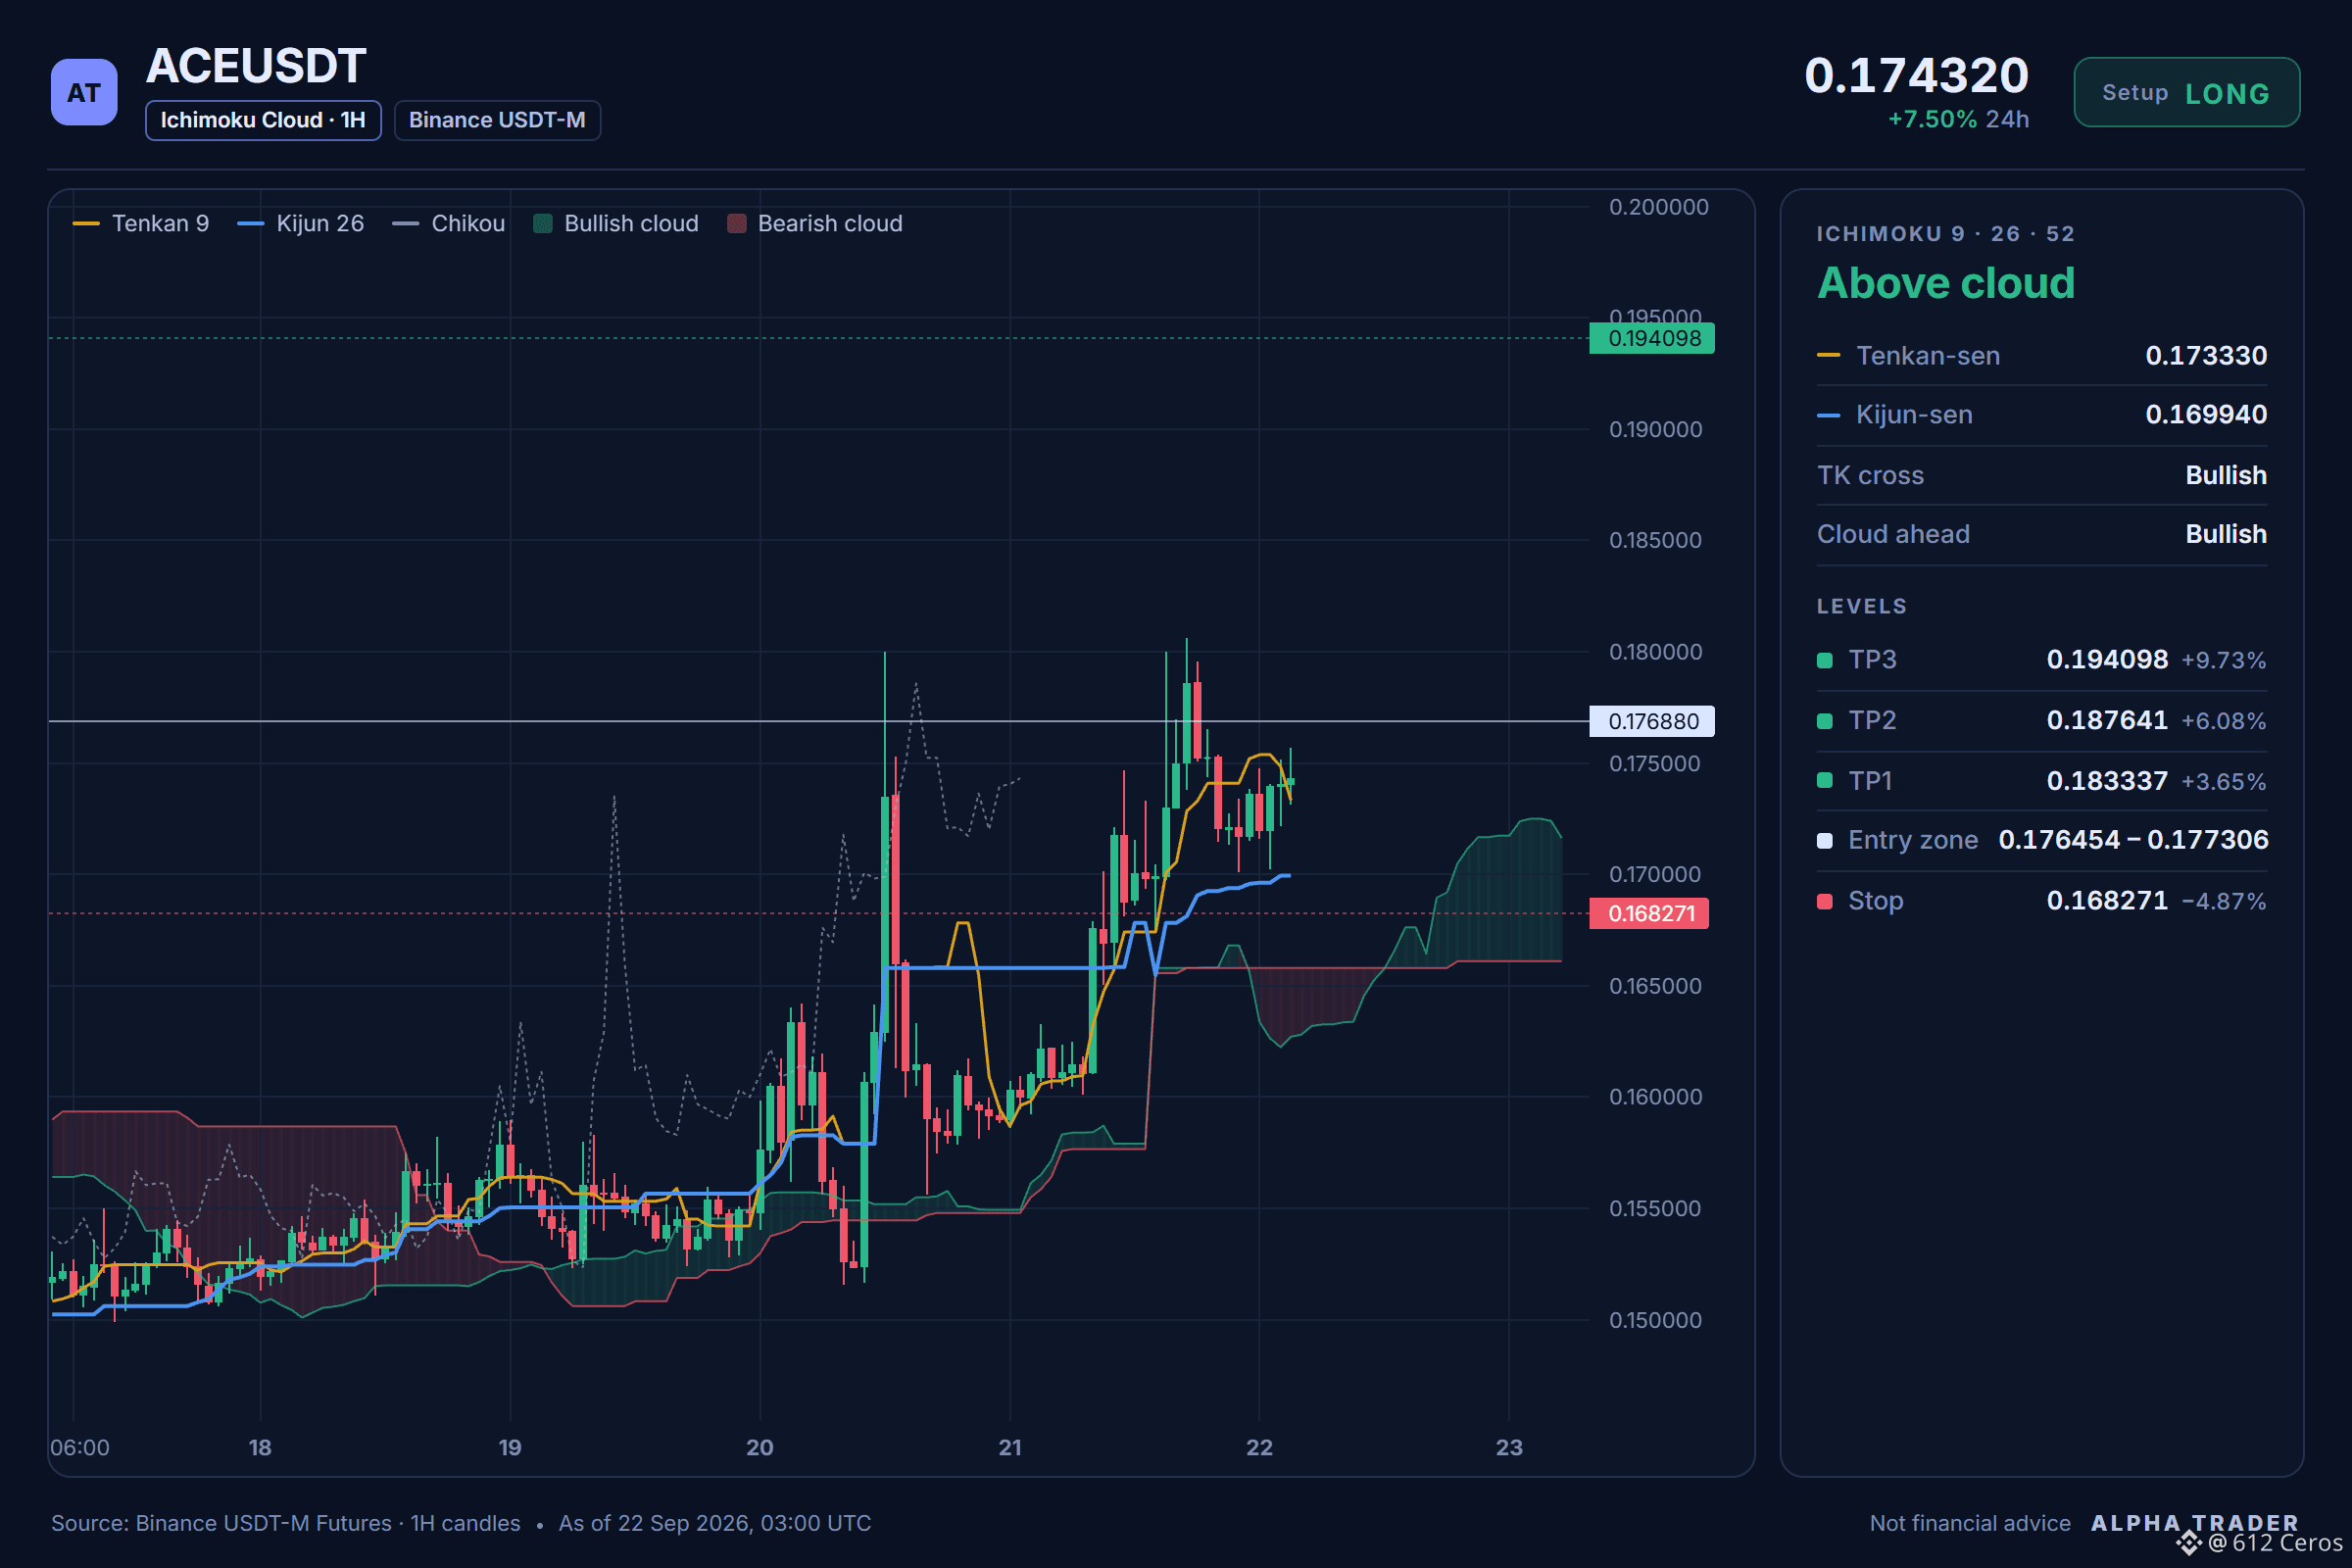
✅ Daily trend: price > EMA50 > EMA200, bullish stack
✅ 1h trend: price > EMA50 > EMA200, bullish stack
✅ 4h RSI: 66.6, bullish momentum (above 55)
✅ 1h RSI: 60.8, bullish momentum (above 55)
No factor points the other way right now.
Price map:
🎯 TP3: 0.194098
🎯 TP2: 0.187641
🎯 TP1: 0.183337
📍 Entry: 0.176454 – 0.177306
🛑 SL: 0.168271
🟢 Bull path:
The 1h price is above the 4h entry zone near 0.176880 and the daily trend is bullish. Price should push toward 0.183337 with 4h RSI at 66.6 showing bullish momentum, then extend toward 0.187641.
🛑 What kills it:
The setup fails if price breaks below the daily invalidation level at 0.156929, invalidating the bullish stack, and I would exit at the stop near 0.168271.
Over to you:
Where do you place your own protective stop on this ACE long given the daily invalidation level?
Click here to view the chart 👇️
⚠️ Personal market analysis only. NFA — manage risk and DYOR.
Educational content, not investment advice or a recommendation to buy, sell, deposit, or withdraw any asset. No paid promotion or referral/affiliate links.
🟢 $ACE /USDT | Bias: LONG (Leaning) | 5/12 signals aligned
⚠️ Leaning only: 7 of 12 signals are still undecided. Keep size light.
Technical verdict: LEANING LONG. 5 of 12 signals aligned, 0 against.
✅ Daily trend: price > EMA50 > EMA200, bullish stack
✅ 1h trend: price > EMA50 > EMA200, bullish stack
✅ 4h RSI: 66.6, bullish momentum (above 55)
✅ 1h RSI: 60.8, bullish momentum (above 55)
No factor points the other way right now.
Price map:
🎯 TP3: 0.194098
🎯 TP2: 0.187641
🎯 TP1: 0.183337
📍 Entry: 0.176454 – 0.177306
🛑 SL: 0.168271
🟢 Bull path:
The 1h price is above the 4h entry zone near 0.176880 and the daily trend is bullish. Price should push toward 0.183337 with 4h RSI at 66.6 showing bullish momentum, then extend toward 0.187641.
🛑 What kills it:
The setup fails if price breaks below the daily invalidation level at 0.156929, invalidating the bullish stack, and I would exit at the stop near 0.168271.
Over to you:
Where do you place your own protective stop on this ACE long given the daily invalidation level?
Click here to view the chart 👇️
⚠️ Personal market analysis only. NFA — manage risk and DYOR.
Educational content, not investment advice or a recommendation to buy, sell, deposit, or withdraw any asset. No paid promotion or referral/affiliate links.