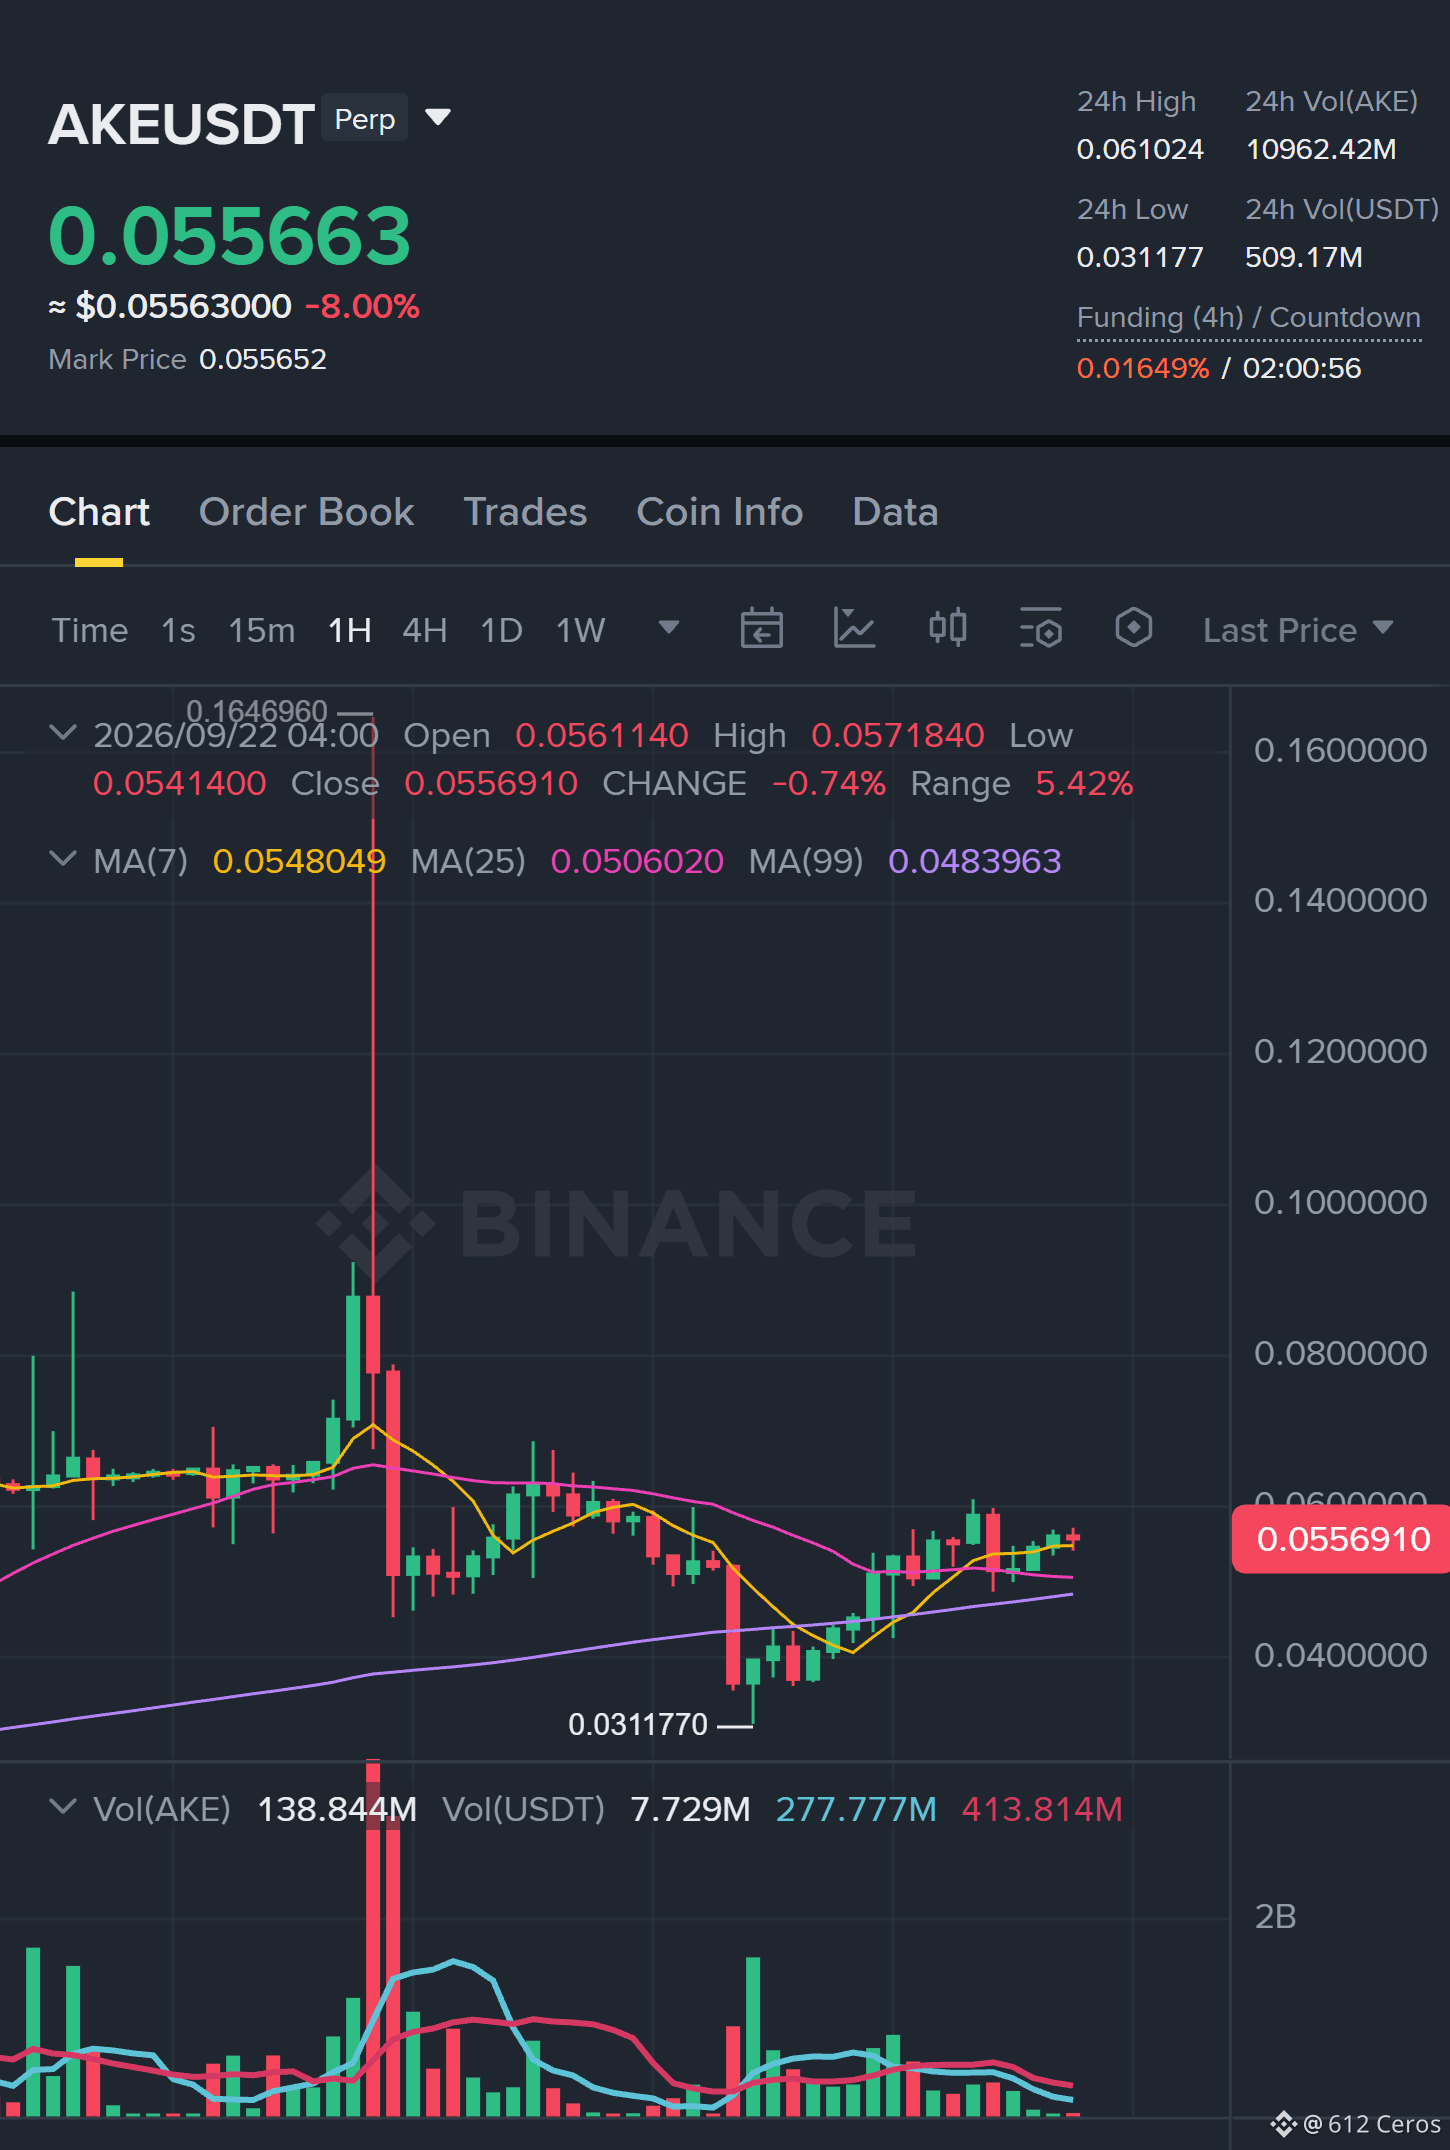
Daily bullish stack on AKE is too clean to ignore right now.
$AKE /USDT - 🟢 Bias: LONG (Leaning) · 4/12 signals aligned
⚠️ Moderate conviction only, 1 signal point the other way. Keep size light.
Technical verdict: LEANING LONG. 4 of 12 signals aligned, 1 against.
✅ Daily trend: price > EMA50 > EMA200, bullish stack
✅ 4h trend: price > EMA50 > EMA200, bullish stack
✅ 1h trend: price > EMA50 > EMA200, bullish stack
✅ 4h RSI: 55.8, bullish momentum (above 55)
⚠️ Relative strength vs BTC: underperforming, −16.29% vs BTC over the last day
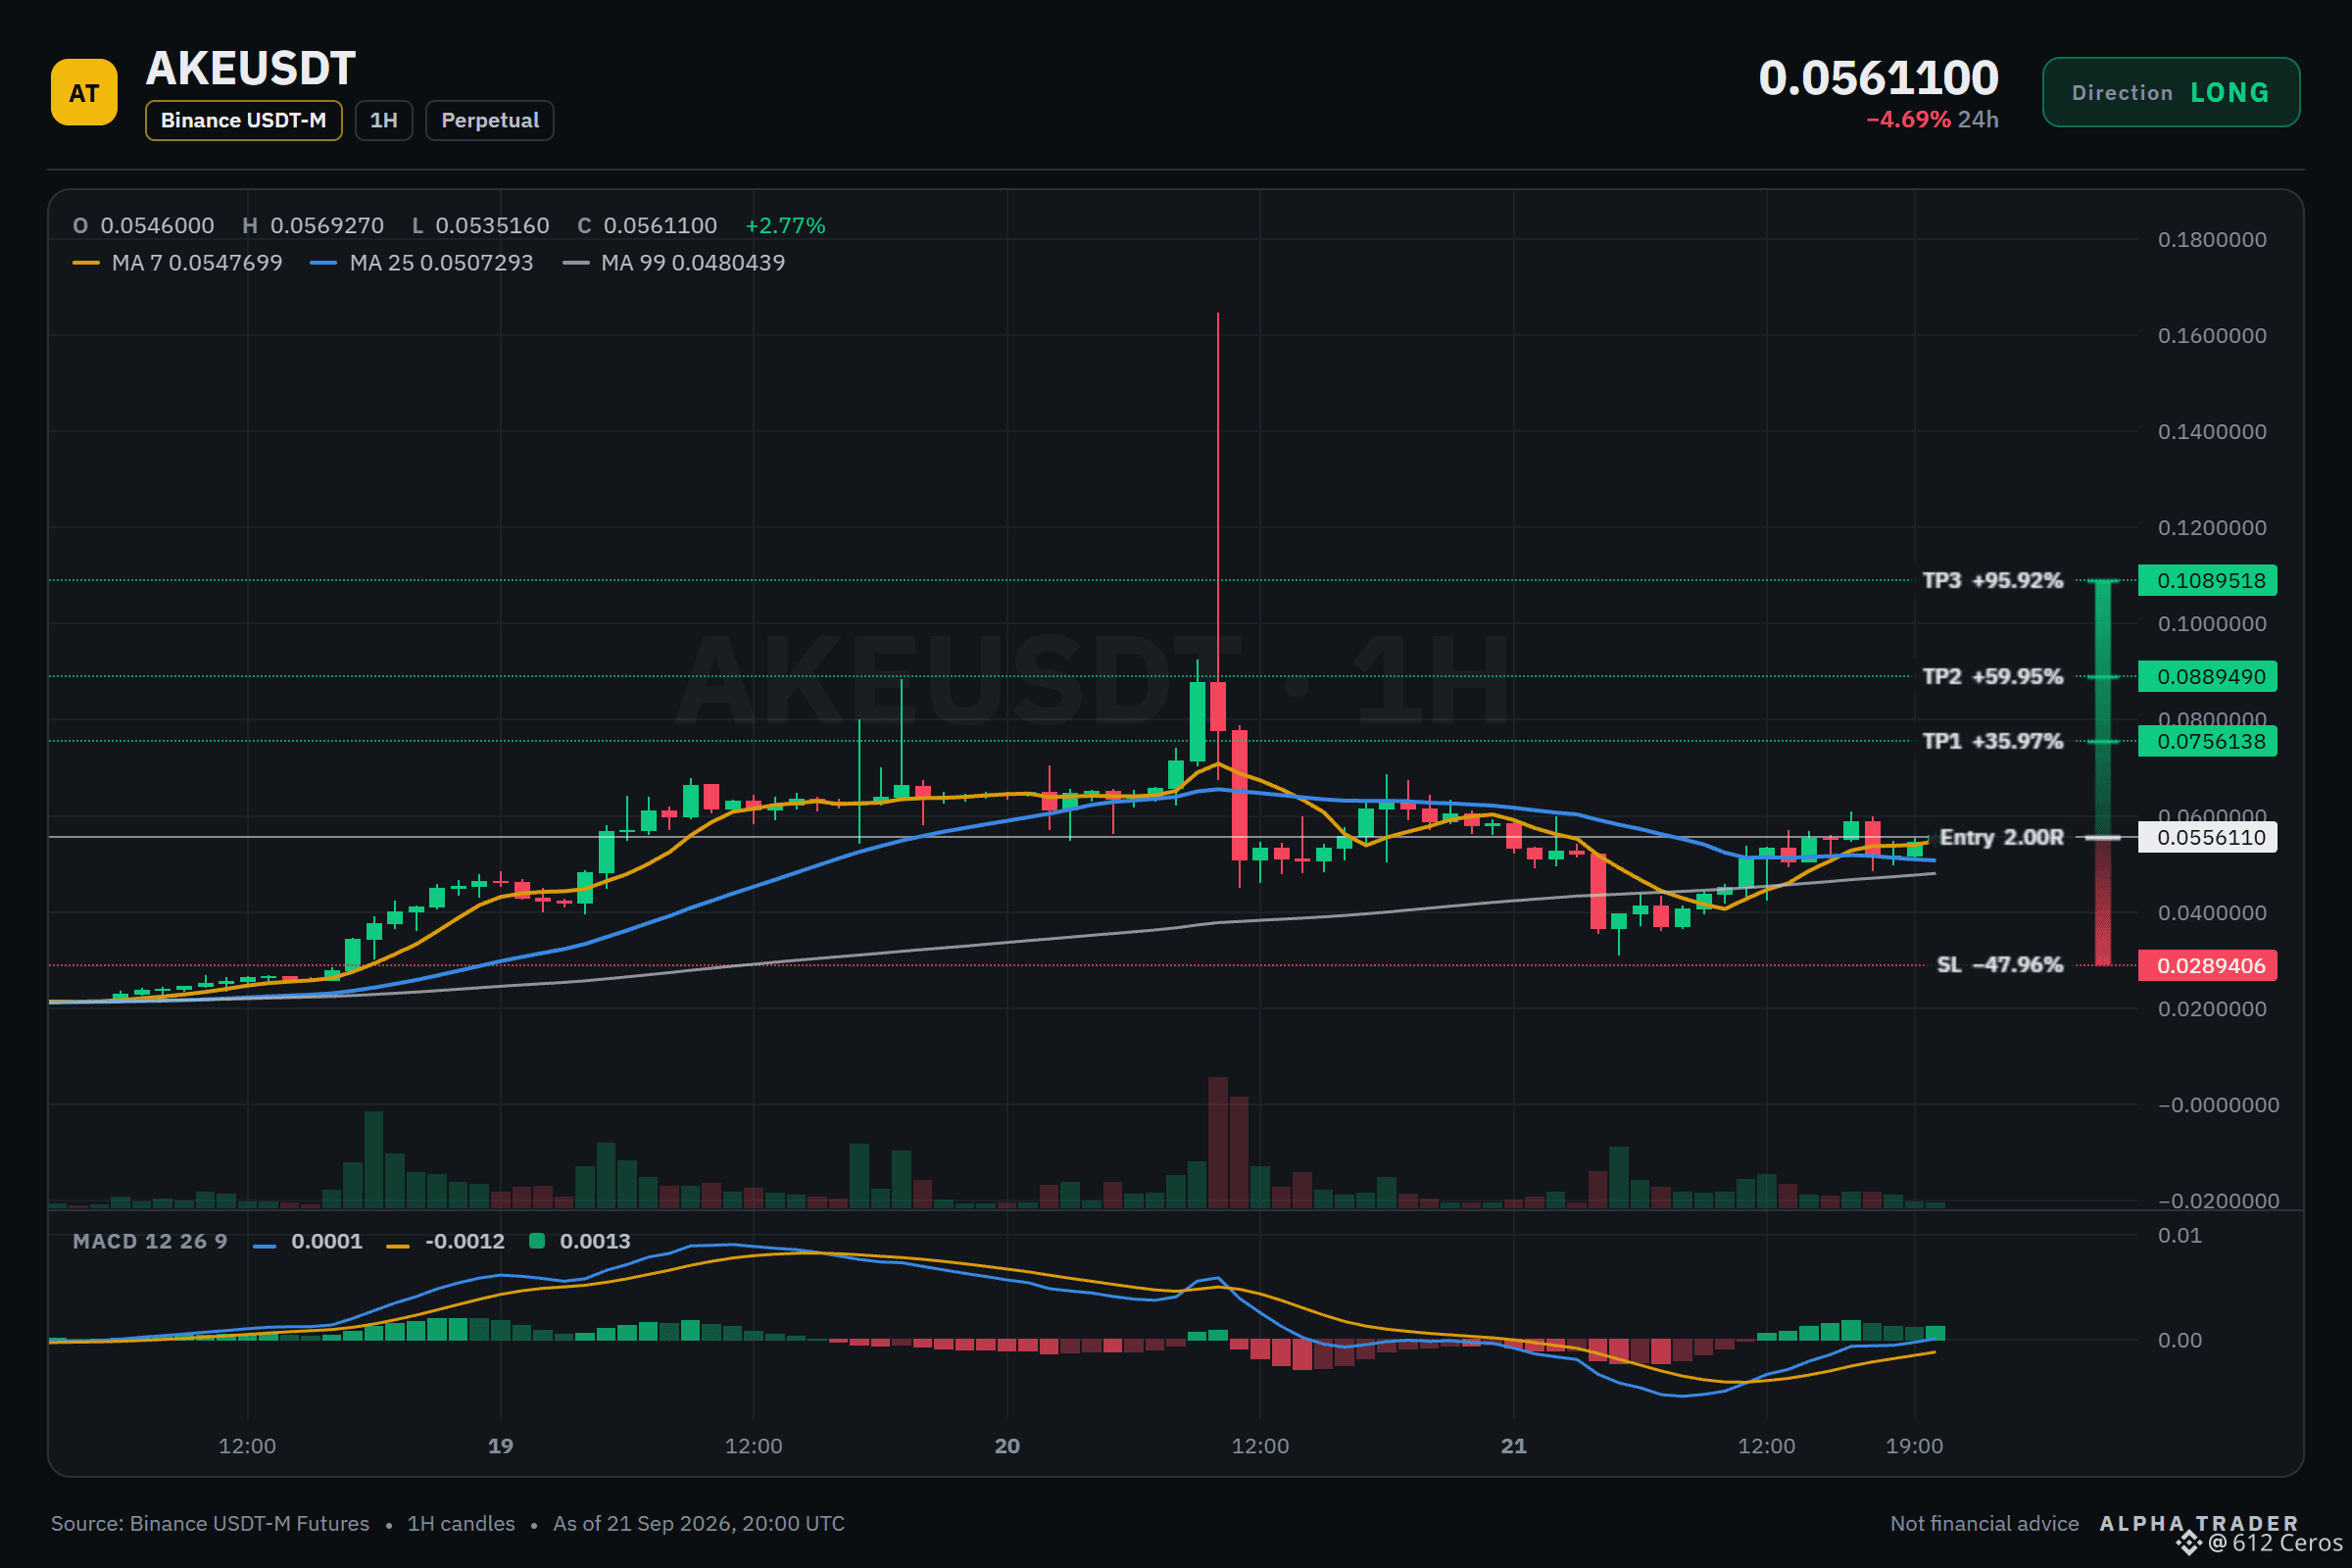
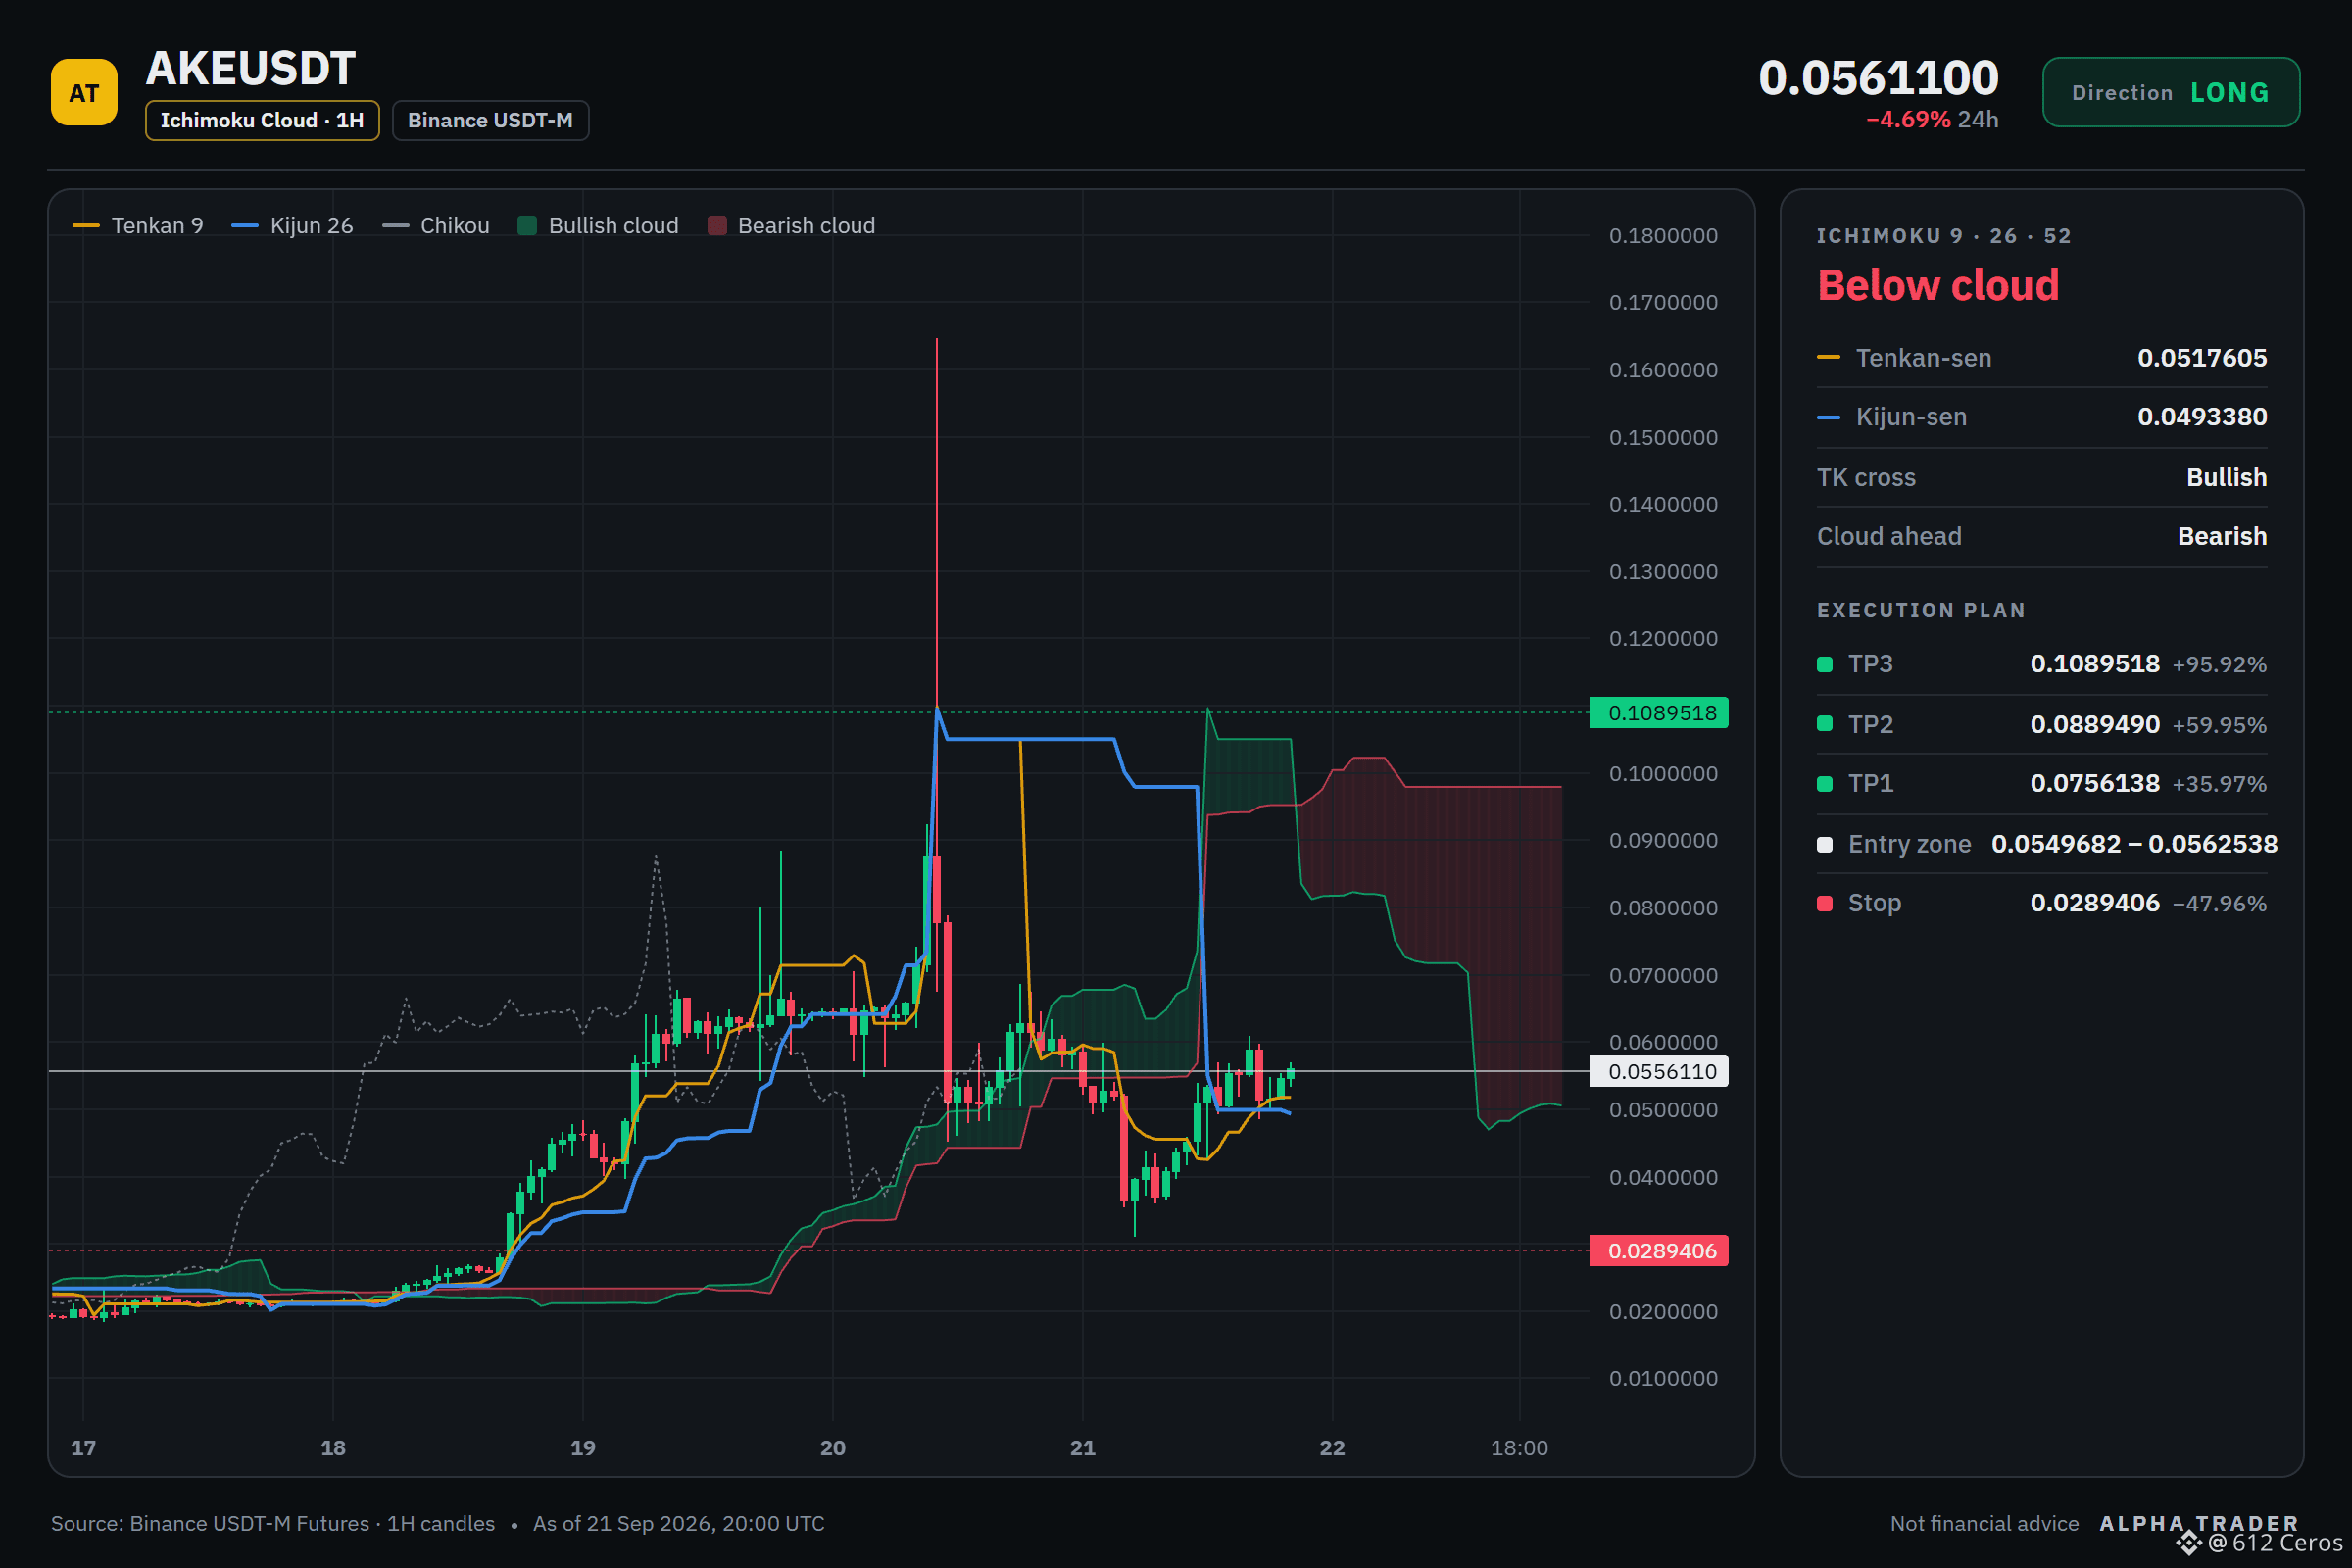
📍 Entry: 0.0549682 – 0.0562538
🎯 TP1: 0.0756138 | TP2: 0.0889490 | TP3: 0.1089518
🛑 SL: 0.0289406
✅ If it plays out:
From the 0.0556110 entry zone I expect AKE to move toward TP1 at 0.0756138, then extend to TP2 at 0.0889490, with the 1h price above the 1h EMA50 and 4h RSI at 55.8 showing bullish momentum behind the push.
❌ If it fails:
The setup fails if 1h price closes below the SL at 0.0289406, which also invalidates the daily bullish stack, so I would exit immediately and reassess the longer-term trend.
💬 Where would you place your own TP1 if you were entering this long from the 0.0556110 zone?
Click here to view the chart 👇️
⚠️ Personal market analysis only. NFA — manage risk and DYOR.
Educational content, not investment advice or a recommendation to buy, sell, deposit, or withdraw any asset. No paid promotion or referral/affiliate links.
$AKE /USDT - 🟢 Bias: LONG (Leaning) · 4/12 signals aligned
⚠️ Moderate conviction only, 1 signal point the other way. Keep size light.
Technical verdict: LEANING LONG. 4 of 12 signals aligned, 1 against.
✅ Daily trend: price > EMA50 > EMA200, bullish stack
✅ 4h trend: price > EMA50 > EMA200, bullish stack
✅ 1h trend: price > EMA50 > EMA200, bullish stack
✅ 4h RSI: 55.8, bullish momentum (above 55)
⚠️ Relative strength vs BTC: underperforming, −16.29% vs BTC over the last day
📍 Entry: 0.0549682 – 0.0562538
🎯 TP1: 0.0756138 | TP2: 0.0889490 | TP3: 0.1089518
🛑 SL: 0.0289406
✅ If it plays out:
From the 0.0556110 entry zone I expect AKE to move toward TP1 at 0.0756138, then extend to TP2 at 0.0889490, with the 1h price above the 1h EMA50 and 4h RSI at 55.8 showing bullish momentum behind the push.
❌ If it fails:
The setup fails if 1h price closes below the SL at 0.0289406, which also invalidates the daily bullish stack, so I would exit immediately and reassess the longer-term trend.
💬 Where would you place your own TP1 if you were entering this long from the 0.0556110 zone?
Click here to view the chart 👇️
⚠️ Personal market analysis only. NFA — manage risk and DYOR.
Educational content, not investment advice or a recommendation to buy, sell, deposit, or withdraw any asset. No paid promotion or referral/affiliate links.