🔥 Chart Pulse: Quick Read on SUI/USDT
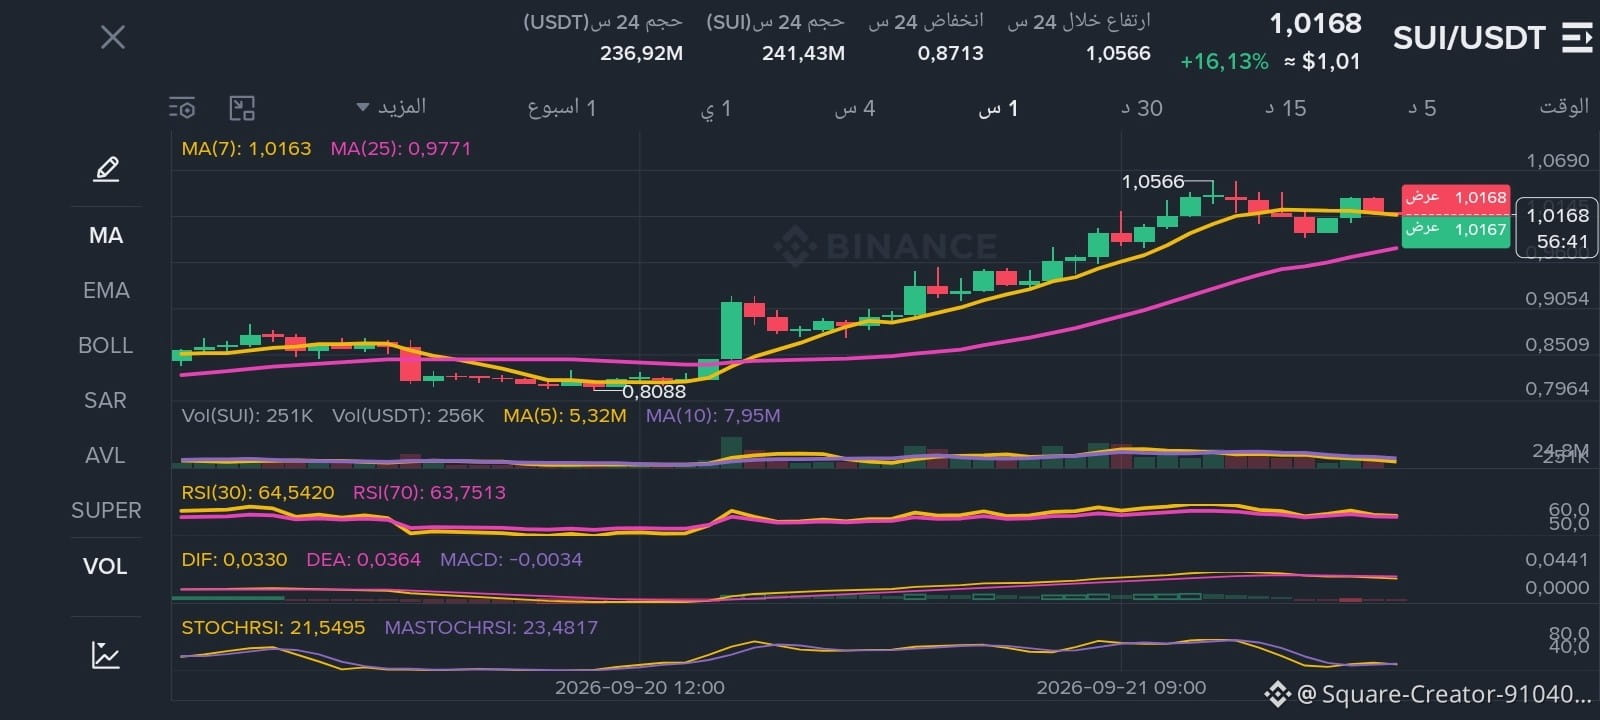
The SUI coin is recording a notably positive momentum with its rise of +16.13%, reaching the level of $1.0168, supported by a strong breakout from support zones near 0.8088$.
📊 What does the chart tell us?
Moving Averages: A clear positive crossover, with the price rising steadily above the moving average lines (yellow and purple), confirming that buyers are in control in the short term.
Momentum Indicators: We notice the Relative Strength Index (RSI) staying stable in good zones, while StochRSI is nearing a crossover—positioning itself for a new upward wave after a period of calm and consolidation near the peak reached at $1.0566$.
🛡️ "Hit and Run" Strategy (Risk Management):
Watch Zone: The current entry near the highs requires caution. It’s best to wait for any retest of the moving average support lines or to monitor a breakout of the 1.0566$ levels with stability.
Stop-Loss: Place a strict stop-loss below the current support lines—this is your lifeline to ensure your capital remains protected against any sudden fluctuations.
Do you think SUI is ready to continue the breakout, or will we see a slight correction first? Share your thoughts in the comments! 👇
#ChartPulse #BinanceSquare #SUI #TechnicalAnalysis #RiskManagement
#NEARRisesNearly80%InAWeek
The SUI coin is recording a notably positive momentum with its rise of +16.13%, reaching the level of $1.0168, supported by a strong breakout from support zones near 0.8088$.
📊 What does the chart tell us?
Moving Averages: A clear positive crossover, with the price rising steadily above the moving average lines (yellow and purple), confirming that buyers are in control in the short term.
Momentum Indicators: We notice the Relative Strength Index (RSI) staying stable in good zones, while StochRSI is nearing a crossover—positioning itself for a new upward wave after a period of calm and consolidation near the peak reached at $1.0566$.
🛡️ "Hit and Run" Strategy (Risk Management):
Watch Zone: The current entry near the highs requires caution. It’s best to wait for any retest of the moving average support lines or to monitor a breakout of the 1.0566$ levels with stability.
Stop-Loss: Place a strict stop-loss below the current support lines—this is your lifeline to ensure your capital remains protected against any sudden fluctuations.
Do you think SUI is ready to continue the breakout, or will we see a slight correction first? Share your thoughts in the comments! 👇
#ChartPulse #BinanceSquare #SUI #TechnicalAnalysis #RiskManagement
#NEARRisesNearly80%InAWeek