

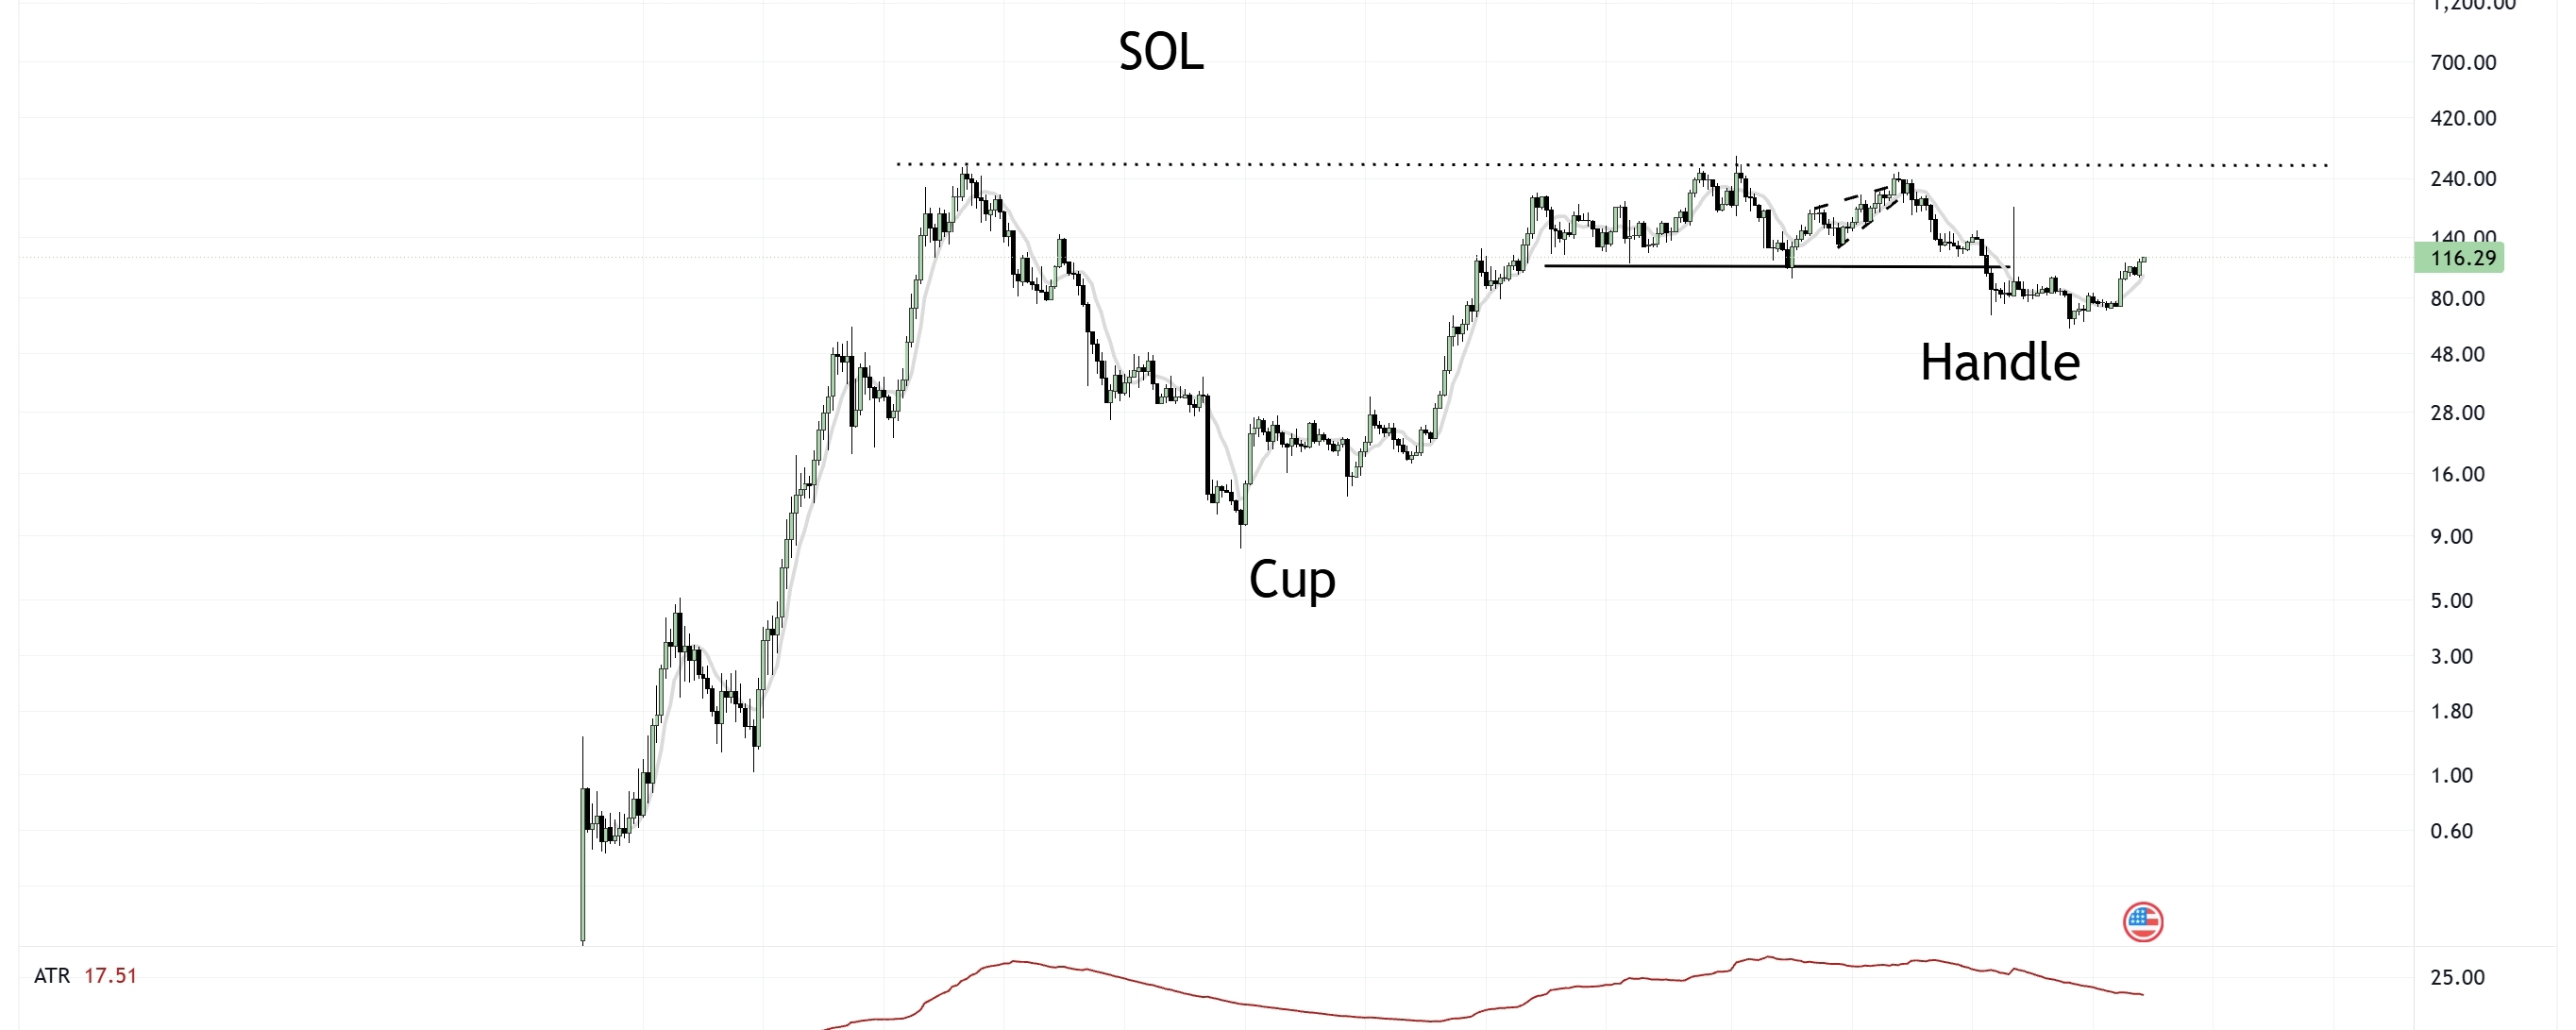

The chart pattern for Solana (SOL) over the course of the past 5 years is approaching its resolution, as the price consolidates for a potential gain of 106% toward the upper edge of the pattern, according to the veteran analyst Peter Brandt.
Technical analyst Peter Brandt published a weekly chart for the SOL/USD pair, pointing to the final stage of compression in a rare macro structure known as the "Cup and Handle" pattern.
Brandt believes this current accumulation represents a "very important long-term vision for Solana." The price is currently trading around $116.29, with the possibility of a local 106% rise toward the pattern’s upper boundary at about $240, which could be a launch point for a much larger macro breakout.
### Pattern details over 5 years
The chart covers Solana’s development cycle over five years:
- The recovery completes toward the 2024 highs, then moves into a two-year sideways trading range to form the "handle".
- Then the asset underwent a deep bottom during the crypto winter in late 2022 near $9.
- The left side of the "cup" starts from the 2021 historical peak.
Technical indicators confirm that the price is "accumulating like a spring" in the final stage of capital accumulation:
- ATR (17.51): Indicates a periodic decline in volatility, with the range of price movements narrowing—something healthy for holding positions.
- ADX (20.10): It stays below 25, confirming the temporary absence of a clear trend, with the market compressed and waiting for a push.
### Where is the bottom of this cup? Two numbers will determine Solana’s fate
According to technical analysis rules on the logarithmic scale, the local 106% move (from the current price of $116.29 to the historical resistance at $240) is only the first stage in reaching the rim of the cup.
The pattern’s real potential becomes evident if a clean breakout occurs above these boundaries. Historically, in traditional markets like gold, similar multi-year consolidations led to strong bullish cycles equal to the full depth of the cup.
On Solana’s logarithmic chart, the distance from the bottom ($9) to the edge ($240) represents an increase of about 26.6x. If the classic scenario plays out, projecting the same ratio upward from the breakout point technically opens the door to long-term Solana price targets in the thousands of dollars.
However, such large structures are extremely rare on crypto charts, so traders approach them with extreme caution.
### The crucial zones that will determine Solana’s path
Until the upper boundary is broken, the pattern remains only a possibility. There are two critical zones that will determine Solana’s path over the coming years:
- Confirmation zone (bullish trigger): A decisive move and sustained consolidation above the historical high within the $240–260 range. This alone confirms a real breakout from the five-year structure and begins realizing the cup’s large upside potential.
- Invalidation zone (downside risk): Losing the current levels and dropping below the psychological support at $80–85. A drop into this zone would completely destroy the "handle" structure and send the asset back into a long-term bearish trend.
Currently, major market participants maintain their positions within the prevailing trading range, waiting for volume confirmation at key resistance levels.