🚨 Chart Pulse: Quick read on BB/USDT movement.. Opportunity or a trap?
Hello dear followers on your page “Chart Pulse”.
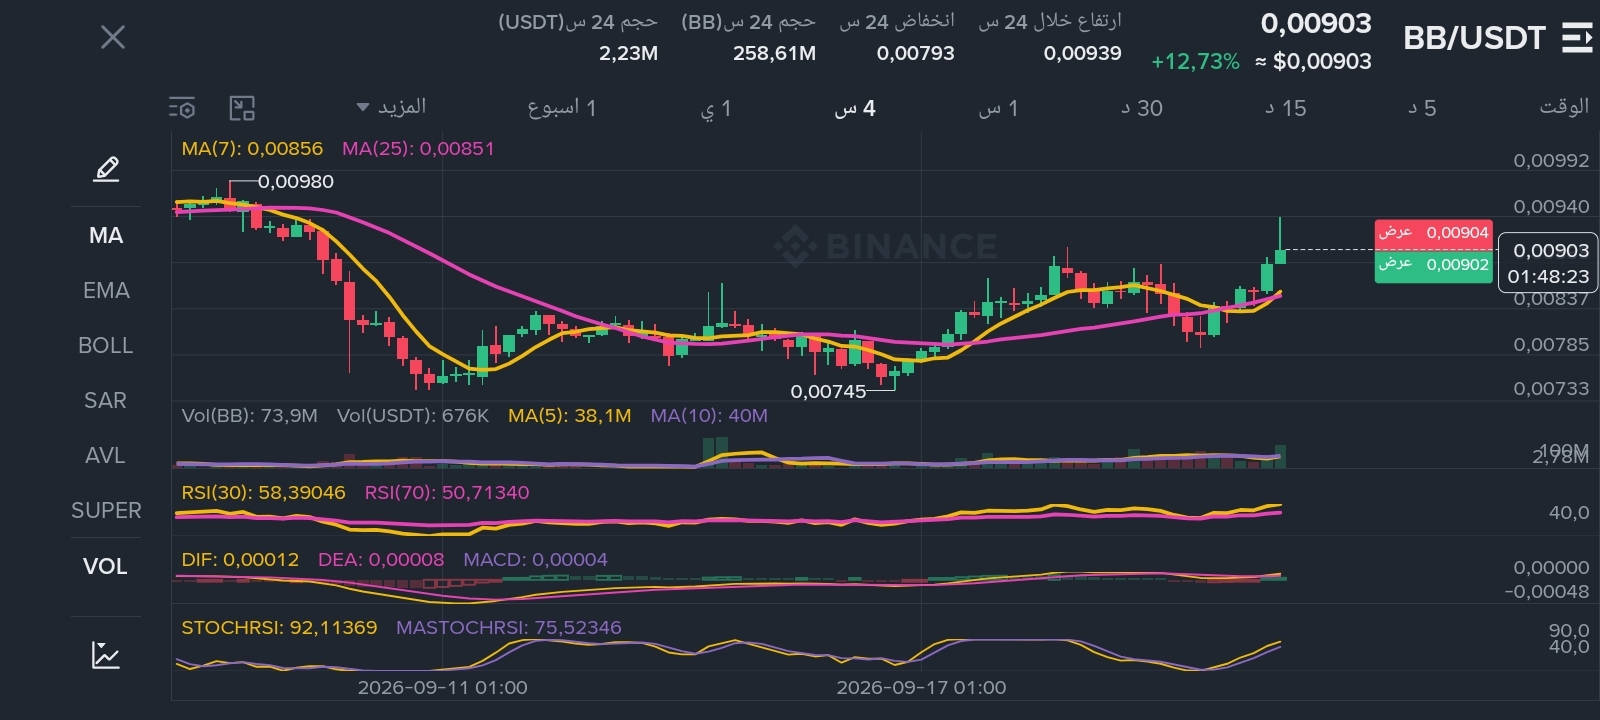
Today we’re following the BB coin on the 4-hour timeframe, which has shown strong reaction with a noticeable rise of +12.73%, reaching a price of 0.00903$ after a clear accumulation wave near the 0.00745$ levels.
📊 What does the chart say?
The bullish bias is evident in the moving averages crossover between the yellow and purple lines, along with the entry of new liquidity that supports short-term buying momentum.
But beware! Momentum indicators are nearing sensitive zones, which may signal a potential profit-taking move or a retest of nearby levels before any new breakout.
🛡️ The “Hit and Run” rule (risk management first):
Watch zone: Random entries into the highs can be costly. It’s better to watch for any slight pullback toward nearby support levels (0.0085$- 0.0086$) to find a safer entry point.
Stop loss: Your commitment to placing a strict stop loss below the moving-average support is your only shield to protect your capital from fast market swings.
Lock in profits and stay cautious, because the market doesn’t forgive randomness! 💡
Share your thoughts: Do you prefer to enter now or wait for the retest? 👇
#ChartPulse #BinanceSquare #TechnicalAnalysis #RiskManagement #تداول_آمن
#ECBStartsBlockchainEuroSettlement
#SouthAfricaProposesCryptoExchangeControls
Hello dear followers on your page “Chart Pulse”.
Today we’re following the BB coin on the 4-hour timeframe, which has shown strong reaction with a noticeable rise of +12.73%, reaching a price of 0.00903$ after a clear accumulation wave near the 0.00745$ levels.
📊 What does the chart say?
The bullish bias is evident in the moving averages crossover between the yellow and purple lines, along with the entry of new liquidity that supports short-term buying momentum.
But beware! Momentum indicators are nearing sensitive zones, which may signal a potential profit-taking move or a retest of nearby levels before any new breakout.
🛡️ The “Hit and Run” rule (risk management first):
Watch zone: Random entries into the highs can be costly. It’s better to watch for any slight pullback toward nearby support levels (0.0085$- 0.0086$) to find a safer entry point.
Stop loss: Your commitment to placing a strict stop loss below the moving-average support is your only shield to protect your capital from fast market swings.
Lock in profits and stay cautious, because the market doesn’t forgive randomness! 💡
Share your thoughts: Do you prefer to enter now or wait for the retest? 👇
#ChartPulse #BinanceSquare #TechnicalAnalysis #RiskManagement #تداول_آمن
#ECBStartsBlockchainEuroSettlement
#SouthAfricaProposesCryptoExchangeControls