【BTC market analysis】9/21
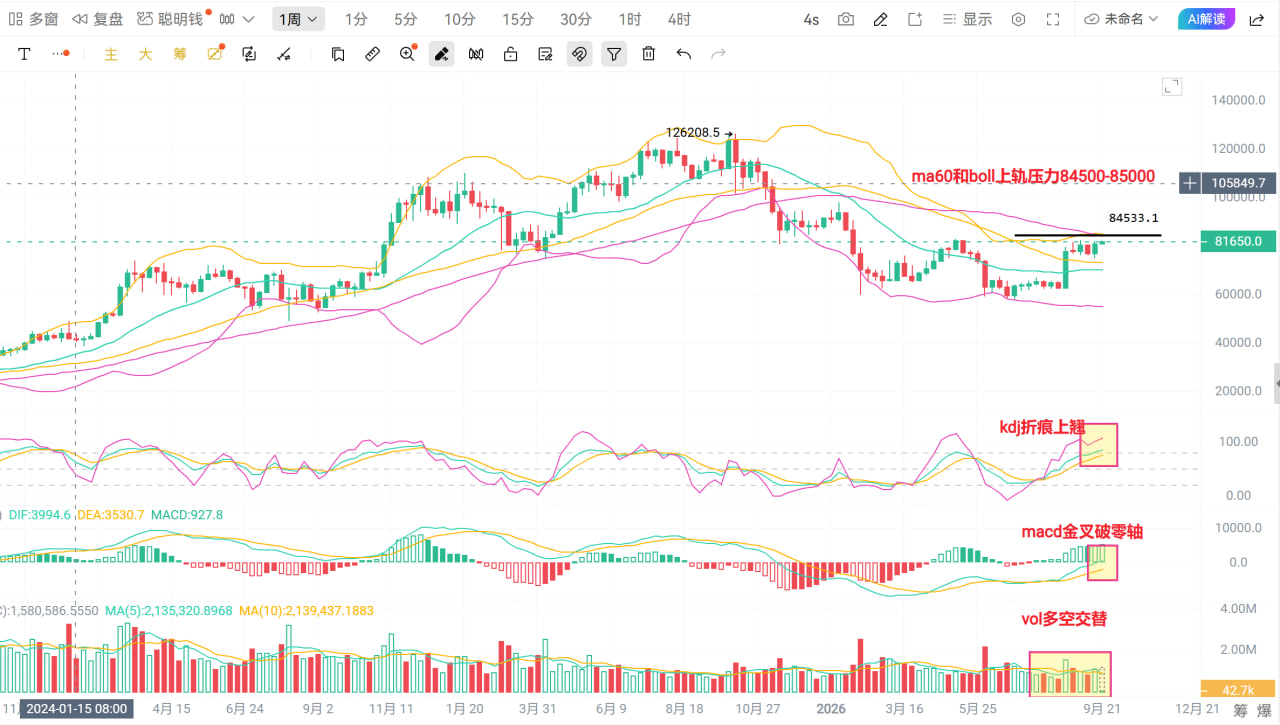
The weekly MACD has formed a golden cross and broken above the zero line—this is something I mentioned before. The significance of breaking the zero line is extraordinary. The monthly indicator (the market-wide indicator) is bullish. Once the weekly MACD has broken above the zero line, it’s already confirmed. The overall trend is a choppy upward movement. After every big surge, the consolidation’s low point shifts upward rather than downward. So, last week’s low of 74,900 will not return. And now the extreme low is 78,000.
As for the KDJ’s high-level “crack marks” (pullback traces)—which I mentioned earlier as well—after each major upswing, the pullbacks won’t drop too much. When it did drop before, it was bound to curl upward again and form an upward trajectory.
Volatility: with 10 consecutive days of alternating long and short signals. This week, starting from now, it has become long. Energy is being released on the bullish side. We should consider that today is Monday: there may be an early rise, but later it could fall—longs turning into shorts will follow this pattern.
From the weekly chart, you can see that when MACD’s golden cross breaks above the zero line, it drives the whole market: the pullback’s low rises. With the upward-trend pullback consolidating, combined with vol and bare K, it shows that 74,900 needs to start an upward trend. This is a chain reaction among indicators—each part links to the next—based on the combined analysis.
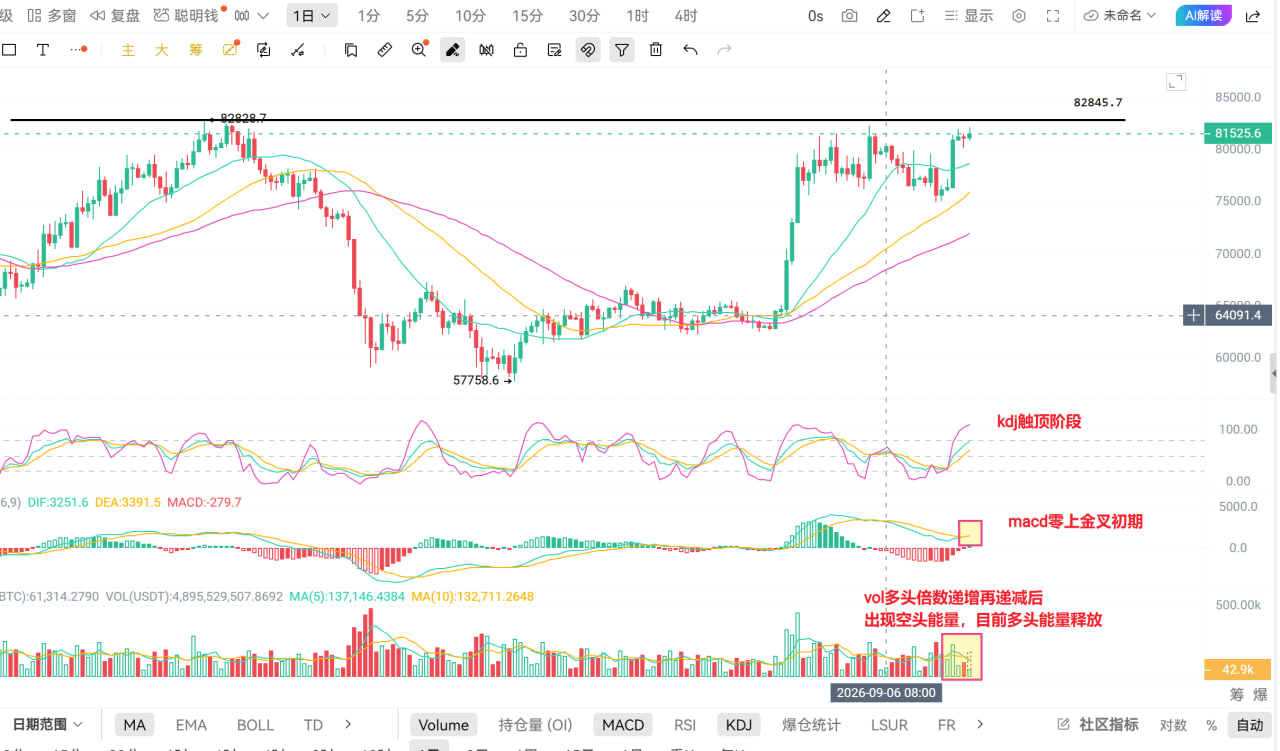
On the daily chart, before the golden cross, the KDJ shows multiple “crack marks,” resembling a boat-bottom formation. This pattern can be understood as either a sideways-to-down move or a sideways minor dip. Ultimately, the golden cross leads to an upswing—so the golden cross after the consolidation also supports the idea that after the big move, the market is in a buildup phase during consolidation, and currently the KDJ is at the top/topping stage.
The initial stage of an on-positive MACD golden cross.
Volatility: after the long side’s increase and decrease, bearish energy appears and is released. However, while bearish energy is being released, the price has not yet shown a large drop. A doji star has formed, indicating that bullish energy is being released.
The K-line’s high-pressure levels: 82,200, and the May high of 82,800. For an upward-cycle market, 82,800 must be broken through. Otherwise, the last high in a bear-market pullback—the first level the uptrend must break—is not met, and then that upward cycle cannot be considered valid.
For the KDJ bottoming stage: it can continue to move sideways and horizontally above, driven by the MACD golden cross. With bullish vol energy and the K-line’s upside momentum, you can see the specific bullish trend on the daily chart.
The 12-hour indicators are also showing bullish momentum.
However, both the daily and 12-hour indicators are bullish overall, but there is also downside risk—because overhead resistance exists, and the KDJ is both in the high zone.
Looking at the long-term weekly indicators overall, there are basically two possibilities:
👆 Text limit. In the next post, follow with #分析行情
$BTC
The weekly MACD has formed a golden cross and broken above the zero line—this is something I mentioned before. The significance of breaking the zero line is extraordinary. The monthly indicator (the market-wide indicator) is bullish. Once the weekly MACD has broken above the zero line, it’s already confirmed. The overall trend is a choppy upward movement. After every big surge, the consolidation’s low point shifts upward rather than downward. So, last week’s low of 74,900 will not return. And now the extreme low is 78,000.
As for the KDJ’s high-level “crack marks” (pullback traces)—which I mentioned earlier as well—after each major upswing, the pullbacks won’t drop too much. When it did drop before, it was bound to curl upward again and form an upward trajectory.
Volatility: with 10 consecutive days of alternating long and short signals. This week, starting from now, it has become long. Energy is being released on the bullish side. We should consider that today is Monday: there may be an early rise, but later it could fall—longs turning into shorts will follow this pattern.
From the weekly chart, you can see that when MACD’s golden cross breaks above the zero line, it drives the whole market: the pullback’s low rises. With the upward-trend pullback consolidating, combined with vol and bare K, it shows that 74,900 needs to start an upward trend. This is a chain reaction among indicators—each part links to the next—based on the combined analysis.
On the daily chart, before the golden cross, the KDJ shows multiple “crack marks,” resembling a boat-bottom formation. This pattern can be understood as either a sideways-to-down move or a sideways minor dip. Ultimately, the golden cross leads to an upswing—so the golden cross after the consolidation also supports the idea that after the big move, the market is in a buildup phase during consolidation, and currently the KDJ is at the top/topping stage.
The initial stage of an on-positive MACD golden cross.
Volatility: after the long side’s increase and decrease, bearish energy appears and is released. However, while bearish energy is being released, the price has not yet shown a large drop. A doji star has formed, indicating that bullish energy is being released.
The K-line’s high-pressure levels: 82,200, and the May high of 82,800. For an upward-cycle market, 82,800 must be broken through. Otherwise, the last high in a bear-market pullback—the first level the uptrend must break—is not met, and then that upward cycle cannot be considered valid.
For the KDJ bottoming stage: it can continue to move sideways and horizontally above, driven by the MACD golden cross. With bullish vol energy and the K-line’s upside momentum, you can see the specific bullish trend on the daily chart.
The 12-hour indicators are also showing bullish momentum.
However, both the daily and 12-hour indicators are bullish overall, but there is also downside risk—because overhead resistance exists, and the KDJ is both in the high zone.
Looking at the long-term weekly indicators overall, there are basically two possibilities:
👆 Text limit. In the next post, follow with #分析行情
$BTC