$SOL price trend analysis
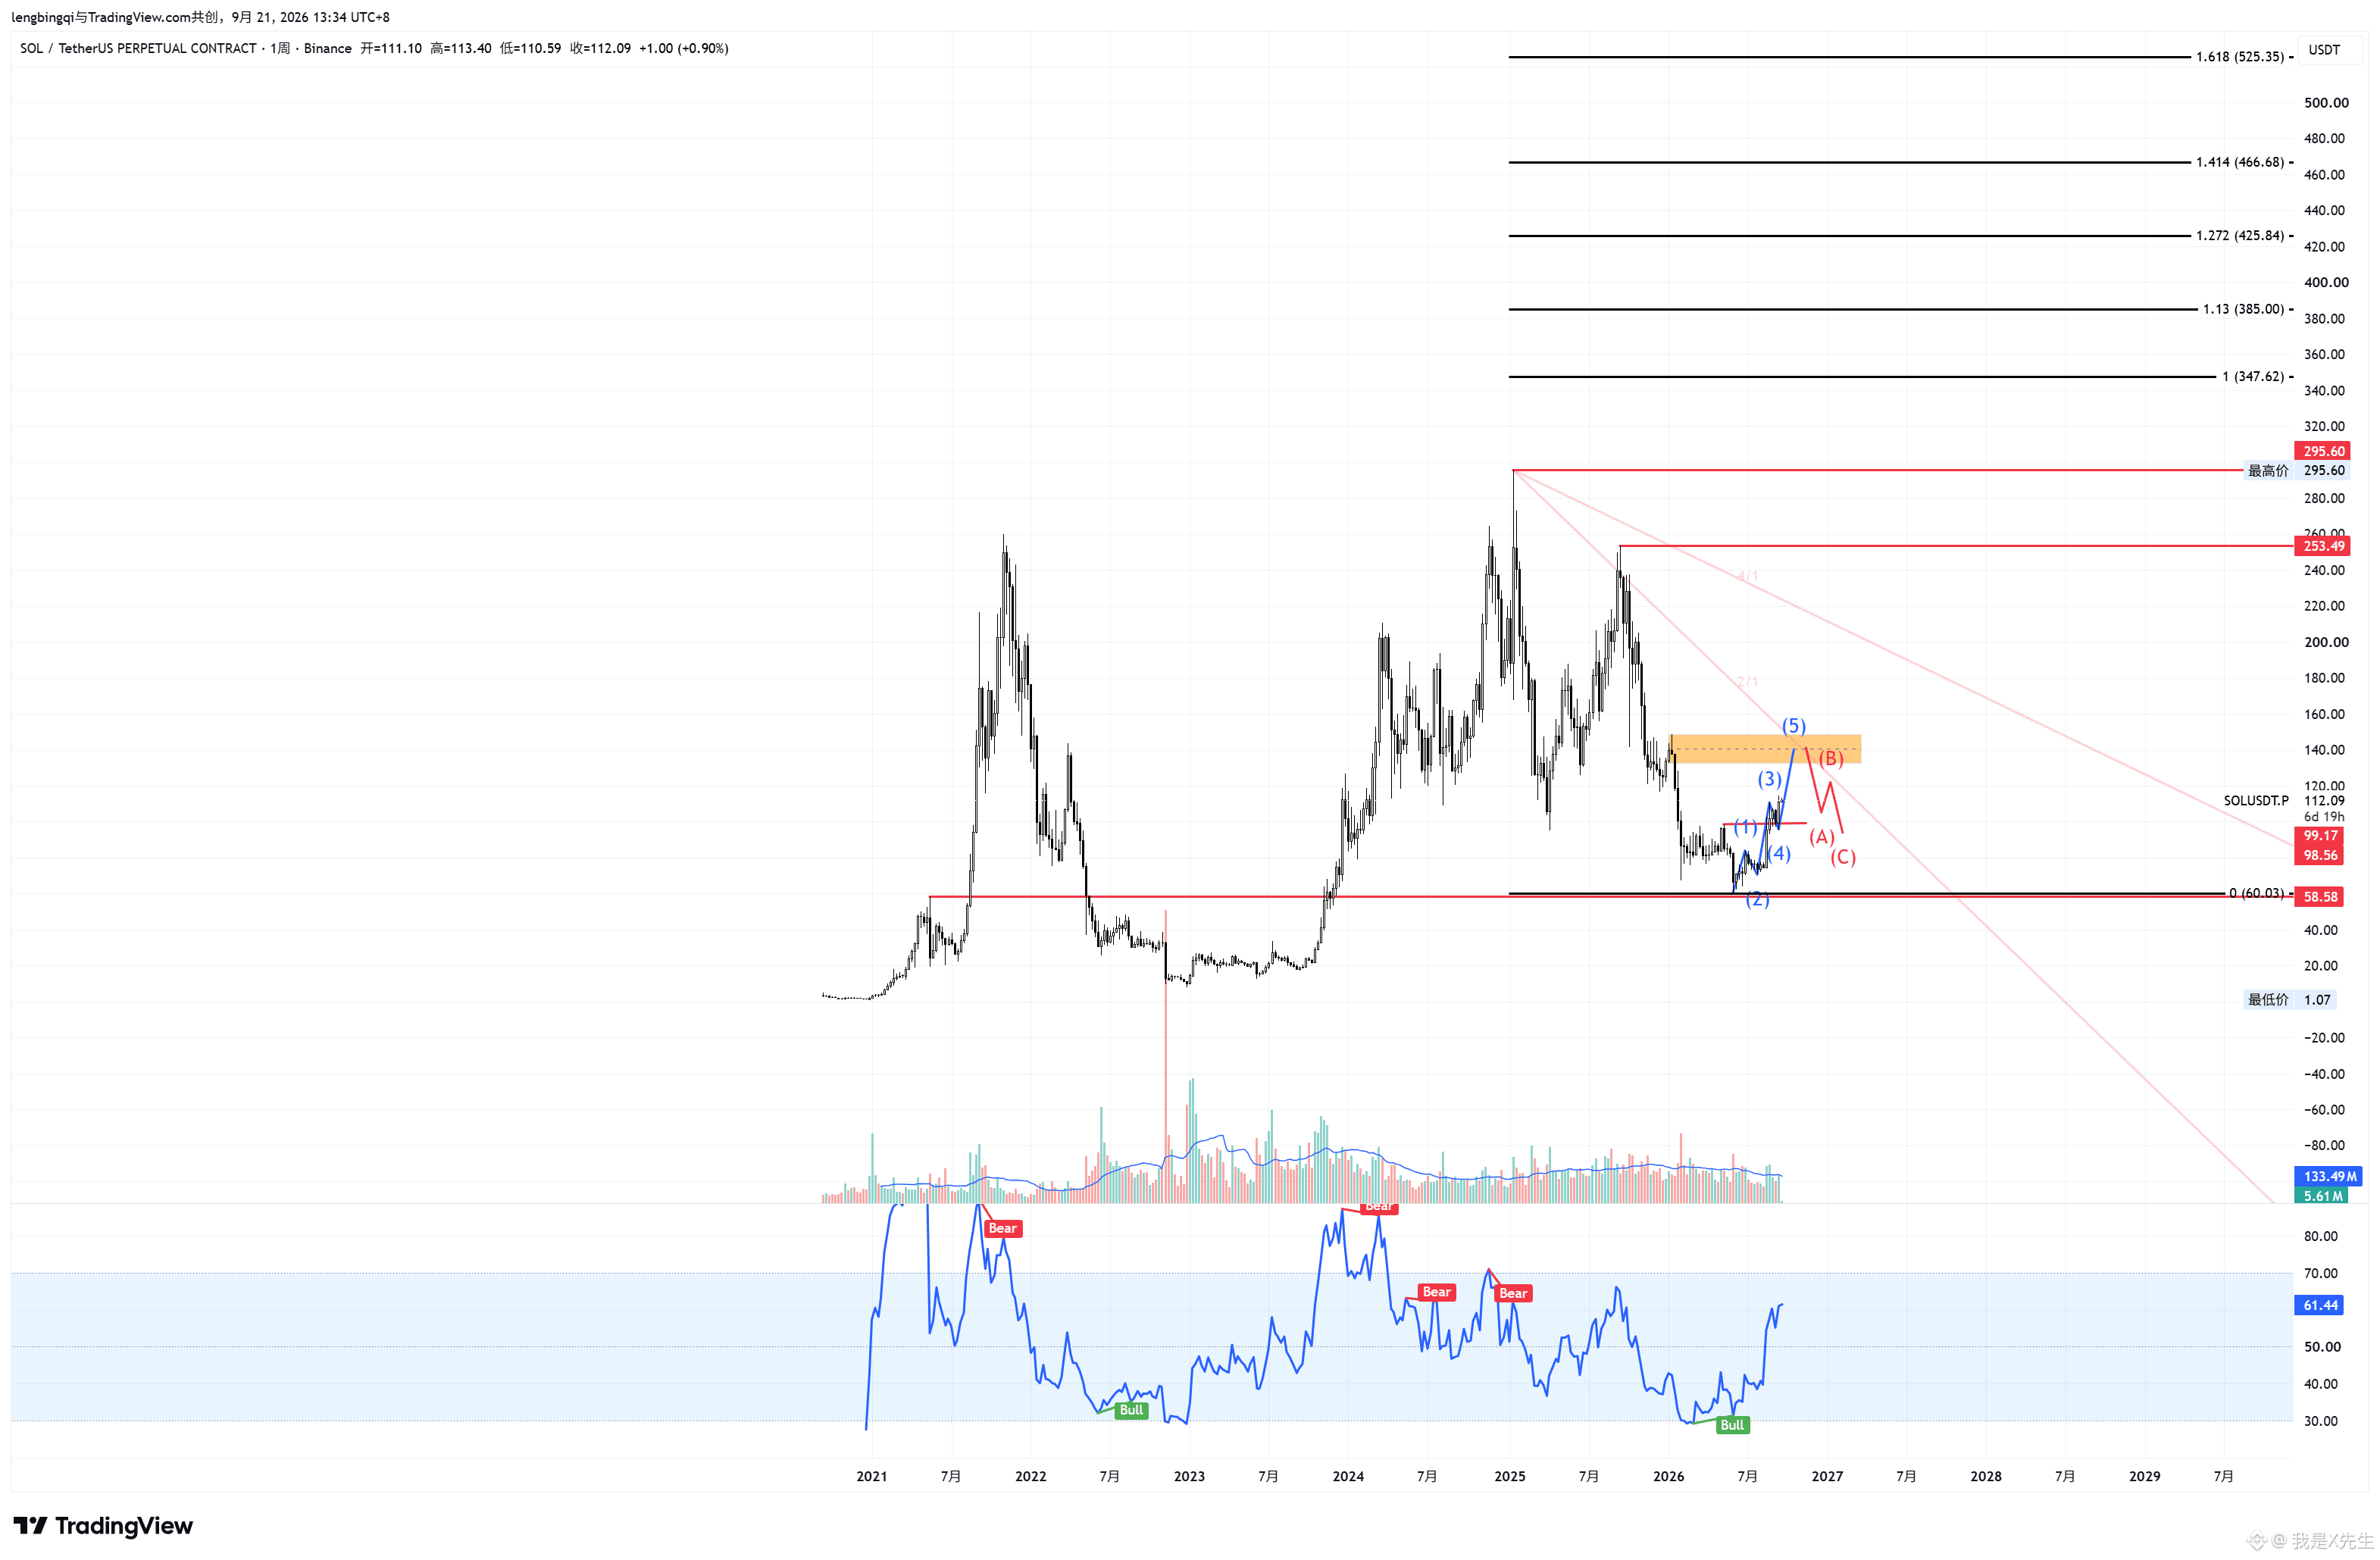
Figure 1: Weekly chart. Currently, if the weekly level does not break below 112 again, the first wave of the 5-wave rally has not ended yet. It may end around the weekly OB at 145, followed by a pullback of an A-B-C correction. After the correction ends, that will be the final opportunity to go long. Going forward, we’re looking at the larger-scale main impulsive upswing, which ultimately may require holding for above 300. For mid-term operations on the weekly chart: if price goes up to 145 OB, go short (betting on a pullback, not a reversal). The downside could be around 80, depending on the specific price action—right now it’s just guesswork.
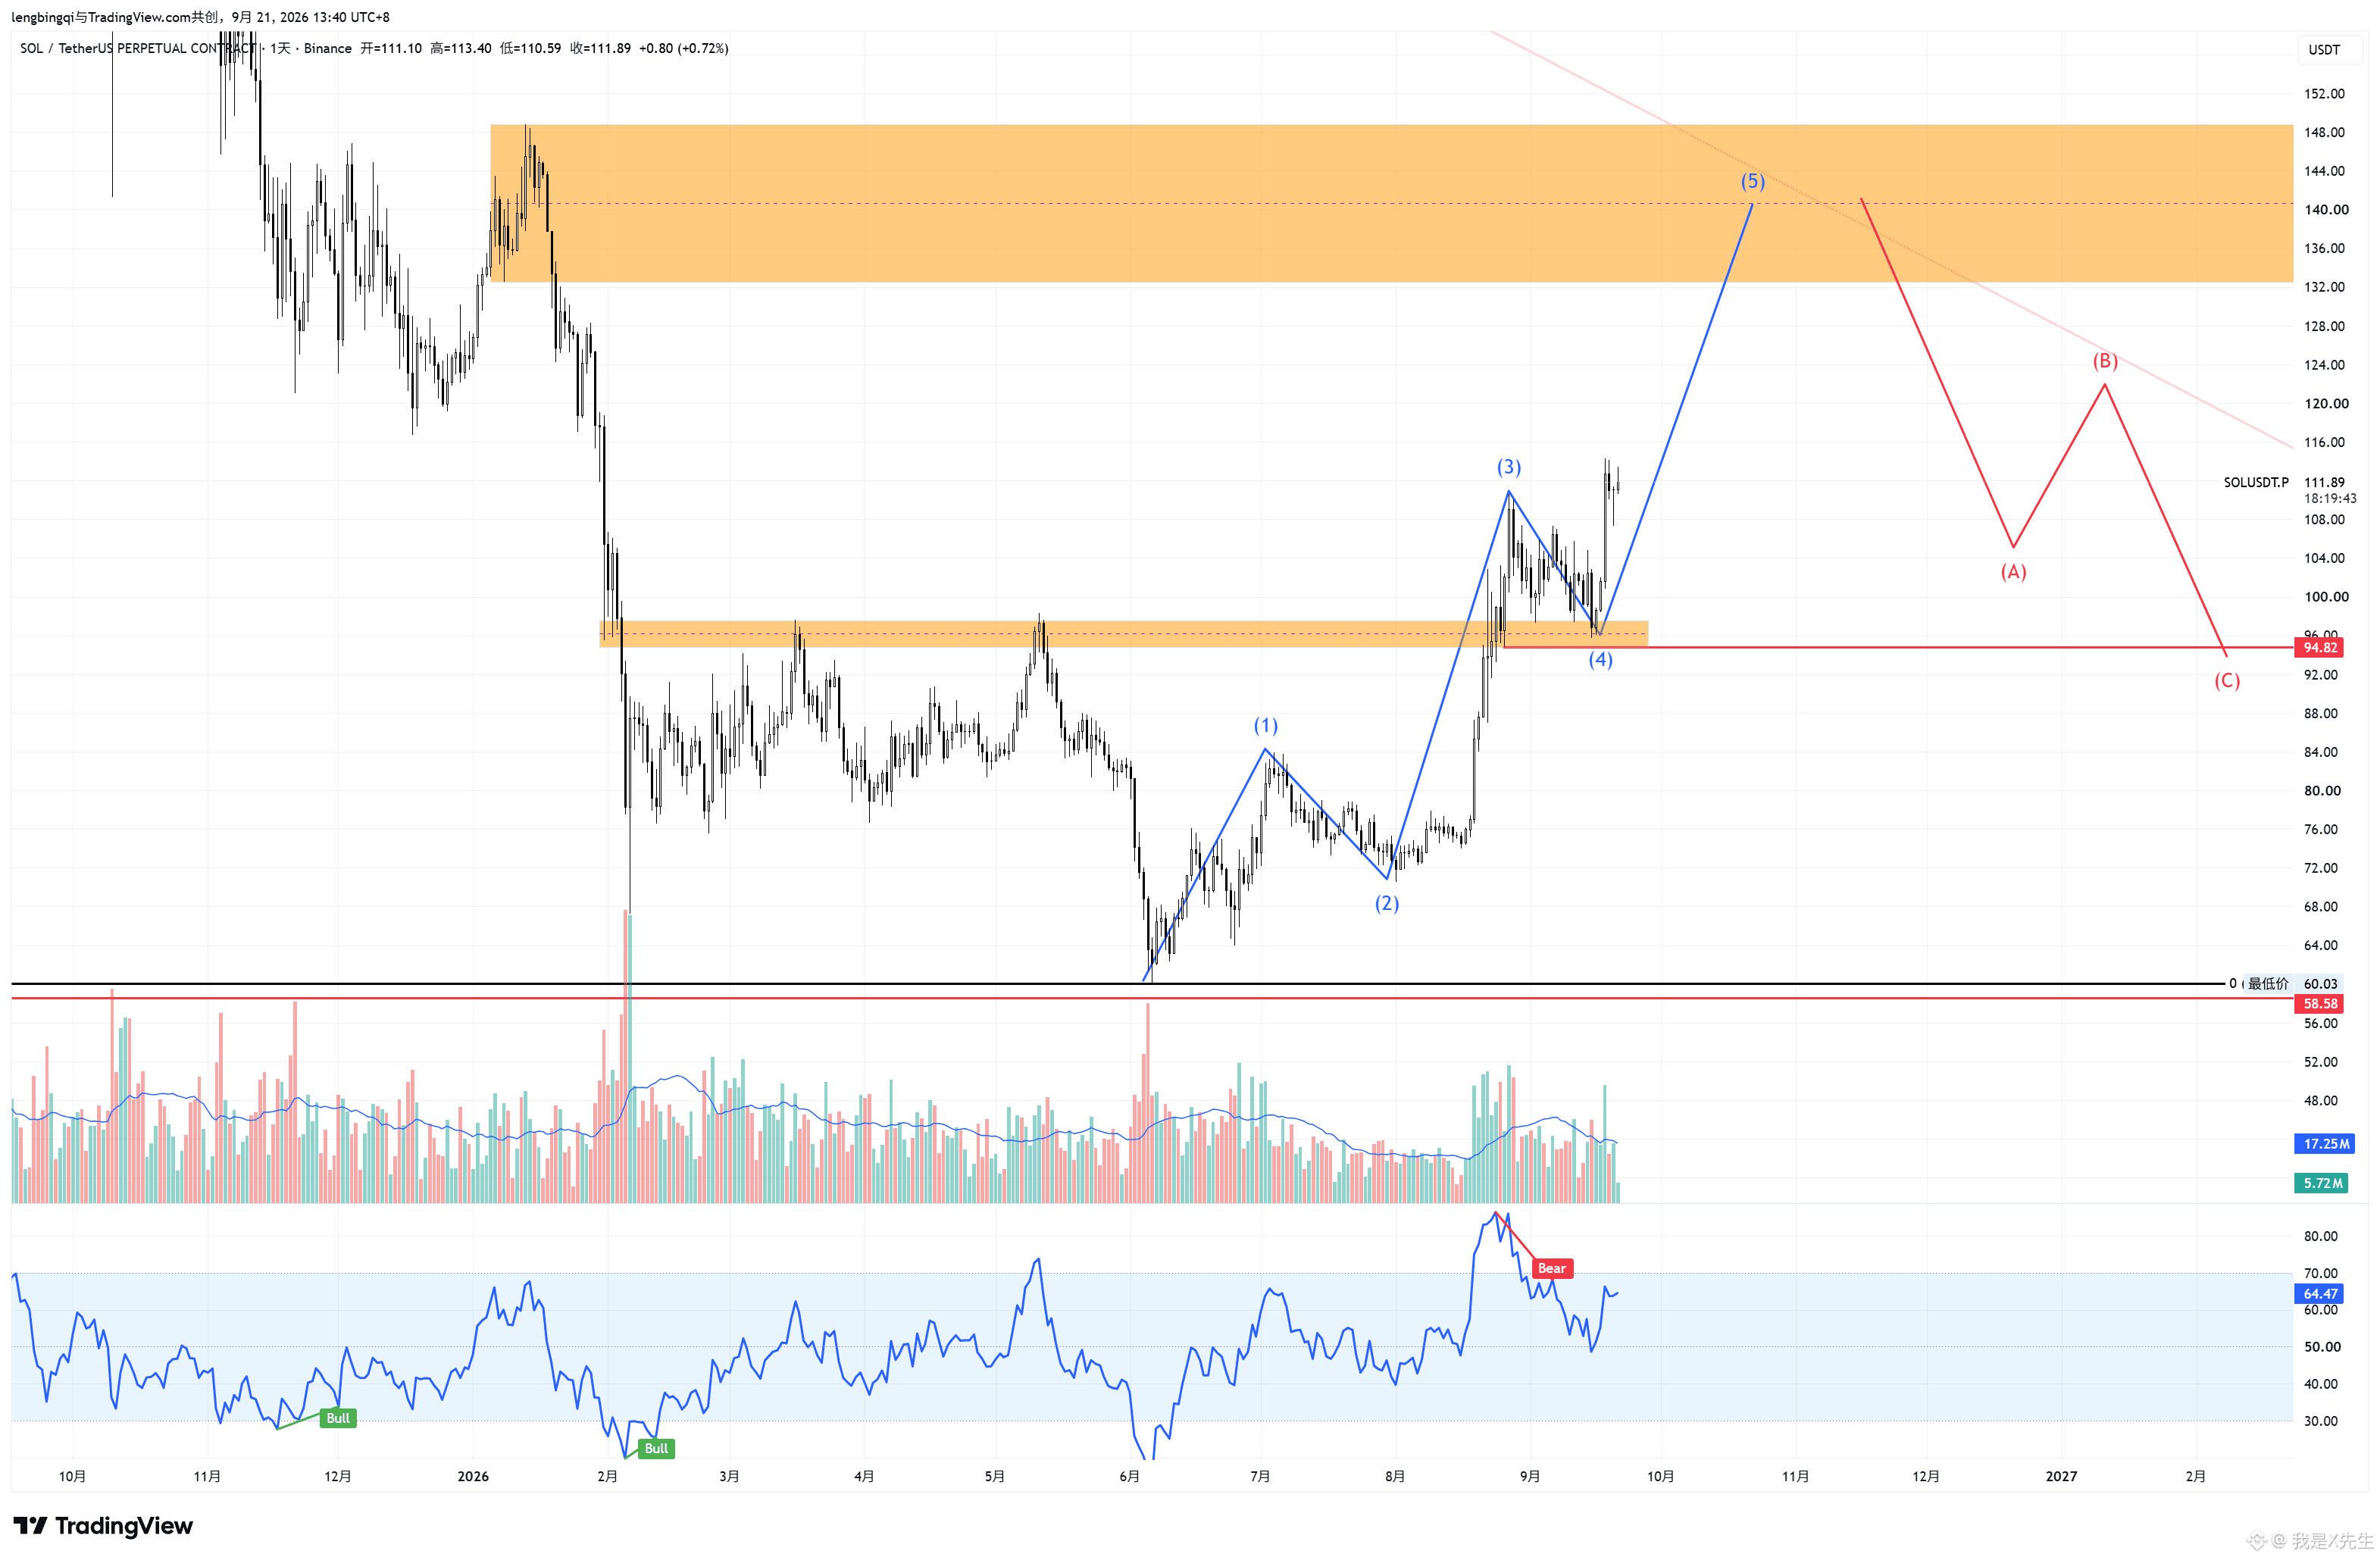
Figure 2: Daily chart. Currently, near the previous high, support is gained through a support-resistance switch. There is a volume-expanded rebound, and there is a basis for further upside. The next step is confirmed: pull back and then go long.
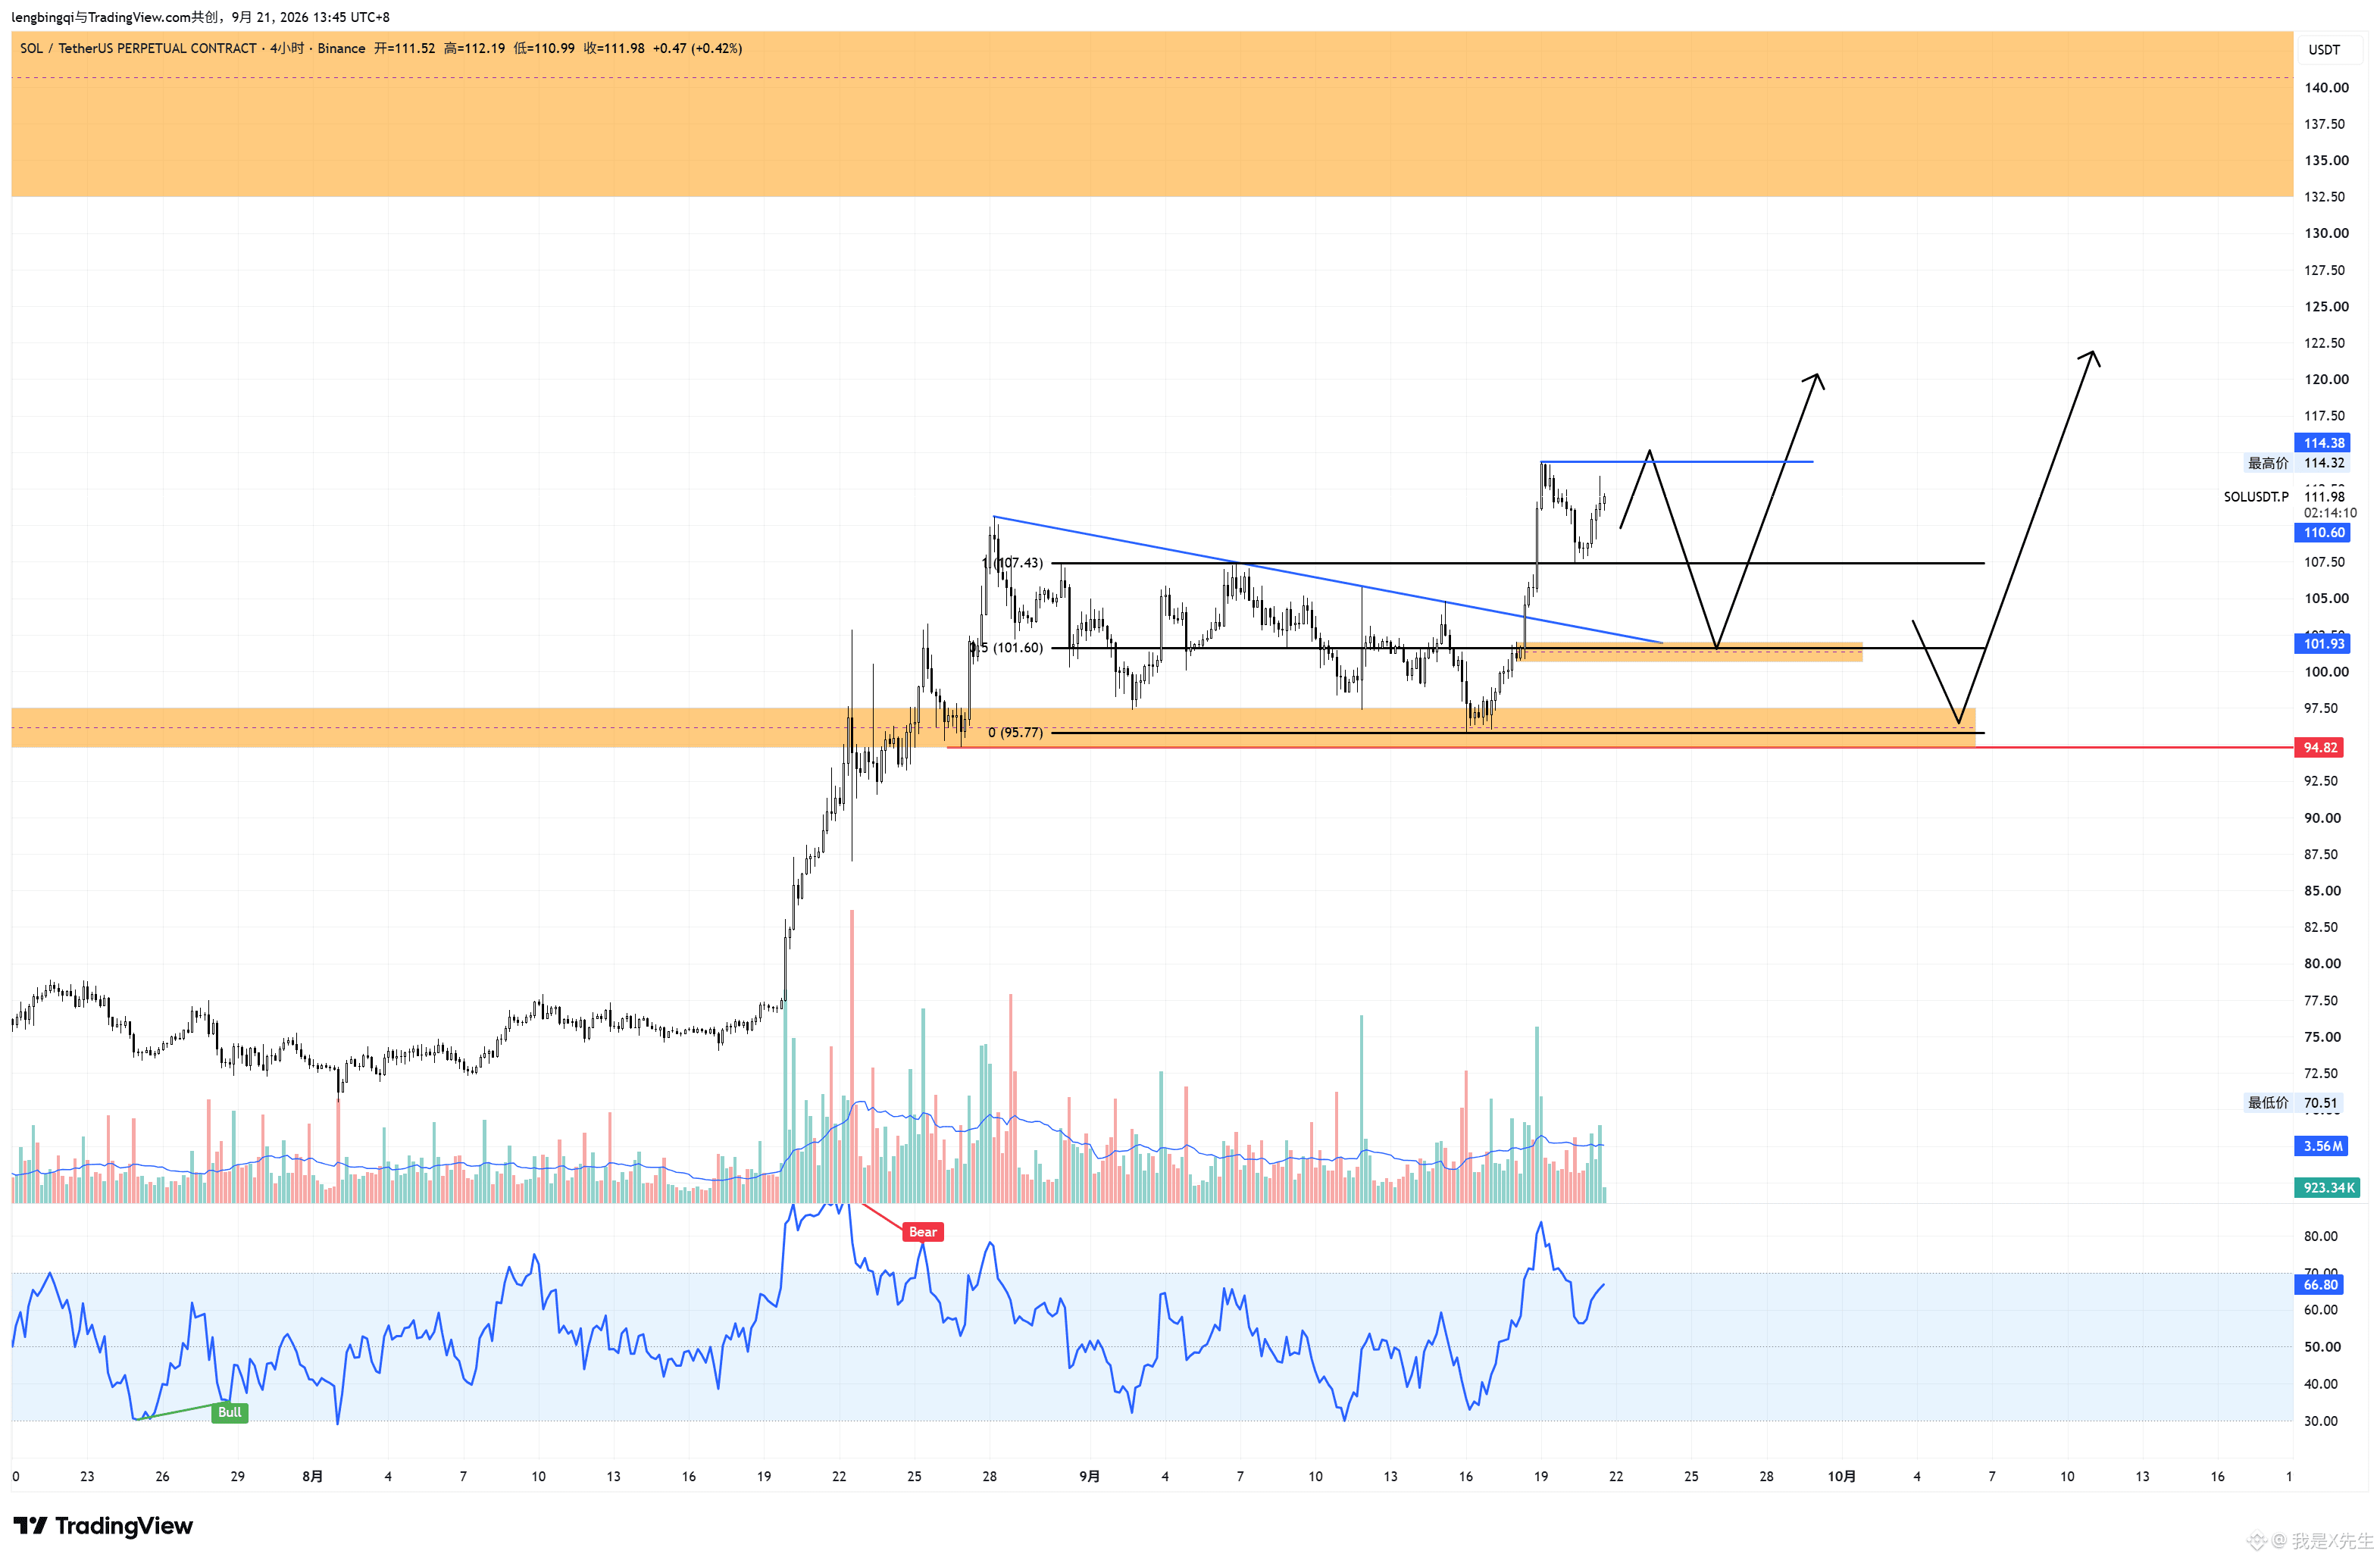
Figure 3 & 4: 4H chart. Current status: price is above the previous high; after a pullback to the upper bound of the range, it found support and rebounded. Next step: if the high at 114.32 is quickly “swept” with a sudden, high-volume selloff, you can short for a move. Otherwise, wait for a pullback—find pullback entry points around 101 and 95 to open long positions.
SOL is currently weaker than BTC and ETH. We need to see whether there is real inflow of on-chain funds before it can break out.
Notes: This article does not constitute investment advice; it is only for providing ideas to myself for placing trades.
Figure 1: Weekly chart. Currently, if the weekly level does not break below 112 again, the first wave of the 5-wave rally has not ended yet. It may end around the weekly OB at 145, followed by a pullback of an A-B-C correction. After the correction ends, that will be the final opportunity to go long. Going forward, we’re looking at the larger-scale main impulsive upswing, which ultimately may require holding for above 300. For mid-term operations on the weekly chart: if price goes up to 145 OB, go short (betting on a pullback, not a reversal). The downside could be around 80, depending on the specific price action—right now it’s just guesswork.
Figure 2: Daily chart. Currently, near the previous high, support is gained through a support-resistance switch. There is a volume-expanded rebound, and there is a basis for further upside. The next step is confirmed: pull back and then go long.
Figure 3 & 4: 4H chart. Current status: price is above the previous high; after a pullback to the upper bound of the range, it found support and rebounded. Next step: if the high at 114.32 is quickly “swept” with a sudden, high-volume selloff, you can short for a move. Otherwise, wait for a pullback—find pullback entry points around 101 and 95 to open long positions.
SOL is currently weaker than BTC and ETH. We need to see whether there is real inflow of on-chain funds before it can break out.
Notes: This article does not constitute investment advice; it is only for providing ideas to myself for placing trades.