



Macroscope and market overview: Rate hike expectations have entered the second phase, and the situation behind the hesitation in the uptrend
In the additional “meal” content from the previous period and the early teaser provided in the public community, we accurately anticipated that Bitcoin would continue to strengthen, and we also conducted an in-depth analysis of how the market would gradually enter the second phase of rate-hike expectations over the coming month. As we predicted, yesterday we alerted the VIP community and public channels to add positions in various types of assets, and today they all saw gains to varying degrees. However, a closer look at the market structure makes it clear that the current rebound still carries a hint of hesitation and lag. How exactly are the tug-of-war between technical factors and macro factors playing out? The following will break down the real logic of the current market in depth, combining cross-asset correlations and order-flow order book dynamics.
Bitcoin (BTC): Bullish structure is established; $83,000 is a resistance level and the response strategy
From the weekly and daily perspectives, Bitcoin is unquestionably in a clear bullish structure. Price is firmly holding above the 200-day moving average, and the 50-day and 200-day moving averages have formed a golden cross. Last week’s weekly candle closed with a strong bullish engulfing pattern, with trading volume smoothly wrapping up the previous cycle. Overall, it shows a rising range-bound trend. The next key target on the daily chart points directly to the crucial parallel high at $83,000.
In terms of trading strategy, when price approaches the top edge of the choppy range between $82,500 and $83,000, prioritize taking profit in batches rather than blindly adding on a chase. Don’t behave like an average retail trader—don’t impulsively think “the main uptrend is starting” just because some KOLs manufacture emotional anxiety, and then get stuck buying near resistance levels.
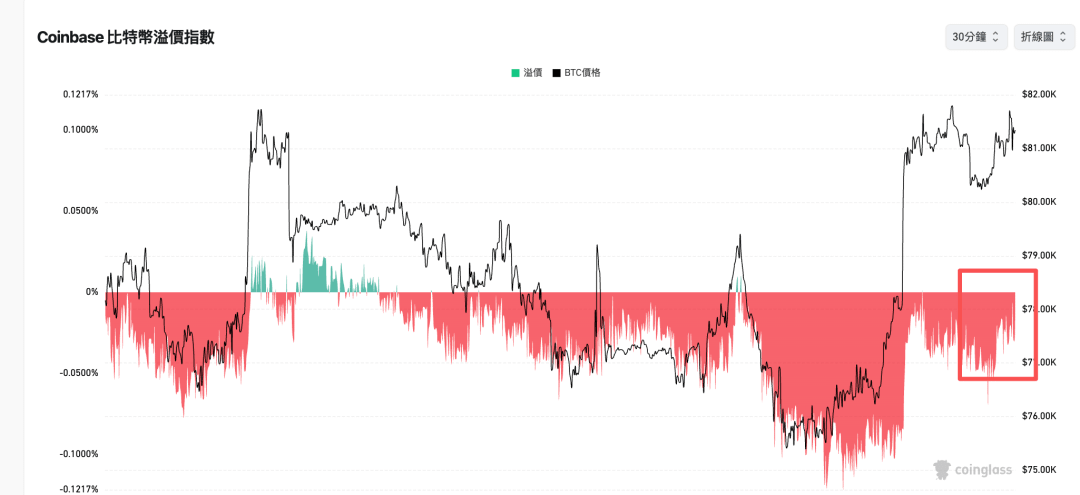
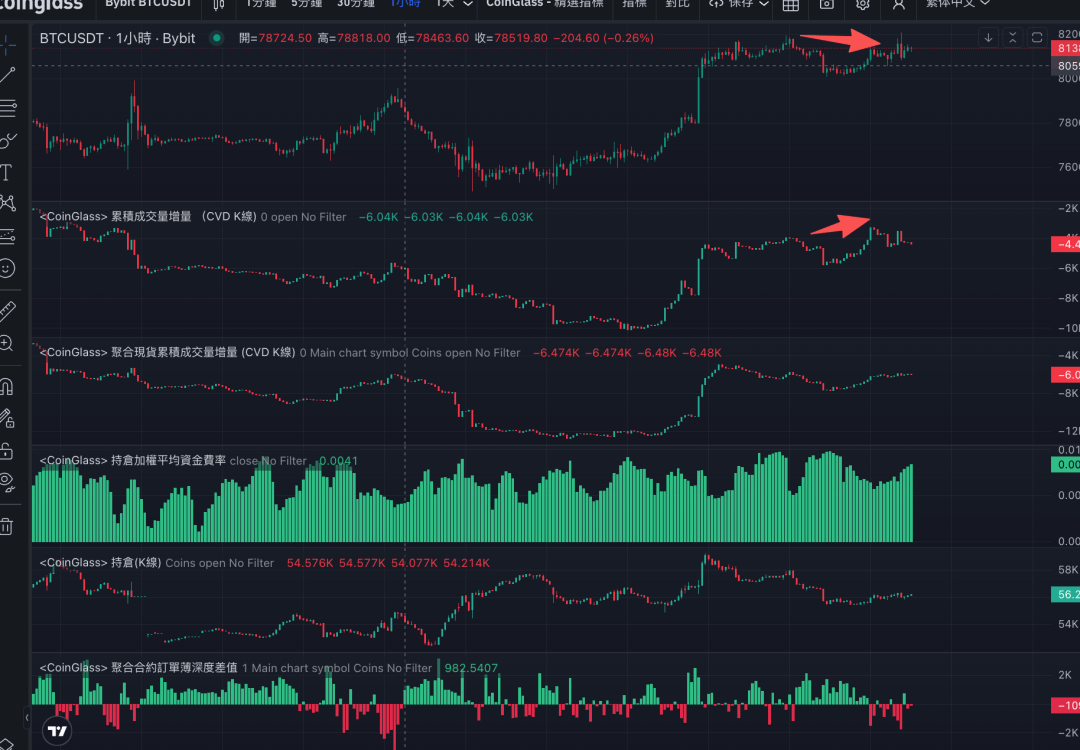
From the micro order-flow and trading tape, although the Coinbase premium index is narrowing while still negative, it has not turned positive yet;
Macroeconomic outlook this week: multiple key events intertwined, with rate-hike expectations facing a test
This week will face multiple major events that directly test the ability of cryptocurrencies and risk assets to continue their upward rally:
Oil price and geopolitical negotiations: If the September 23 discussions between the US and Iran regarding oil prices and the war situation send out positive signals, and that pushes oil prices even lower, it will effectively ease the pressure from the recent spike in yields on both the front and long ends of US Treasuries, providing room for risk assets to breathe.
Key economic data and the Fed’s stance: On Tuesday this week, ADP employment data will be released. Meanwhile, Fed officials Williams and Jefferson will give speeches after a month of silence. Whether their tone is hawkish or dovish will directly determine whether the market strengthens or weakens rate-hike expectations.
US Treasury auctions and PMI data: This week, 2-year, 5-year, and 7-year Treasury bonds will be auctioned in a concentrated manner. If Treasuries lack good demand/absorption, combined with PMI data showing the economy remains overheated, the market’s rate-hike expectations may be reinforced again, which would in turn suppress the crypto market.
Traditional asset linkages: a tug-of-war at gold’s resistance level; US stocks at highs should take profits
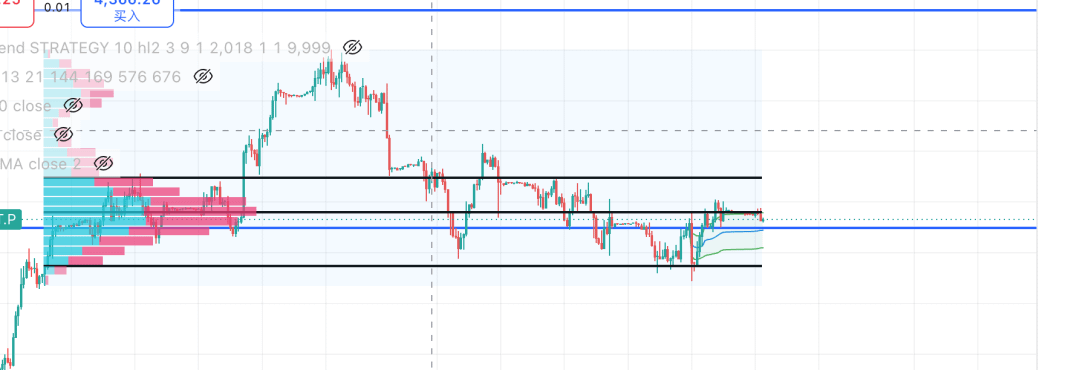
Gold (XAU): After an accurate pullback to the $4,300 cost line, gold rebounded, but it is currently getting stuck and blocked in the high-volume trading area near the POC (around $4,370). In the short term, only a valid breakout above $4,370 can open up continued upside toward $4,700. The medium-to-long term bullish thesis for gold remains unchanged, but in the short term you still need patience—treat it as a consolidation range.
US stocks and the semiconductor sector: US stock indexes are relatively strong, but they’re already approaching structural highs. Given that rate-hike expectations may strengthen, the semiconductor stocks previously suggested for positioning—SanDisk, Micron (Micron), Broadcom (Broadcom)—as well as leveraged ETFs (such as SOXL), are all recommended to “sell some to take profits” and lock in gains in batches, to reduce the high-volatility risk that comes with potential market pullbacks.
Altcoin focus trade breakdown: SUI, SOL, ENA, DOGE, XRP trading setups
SUI (Sui): On the daily timeframe, SUI has already held above the 200-day moving average. The weekly chart closed with an engulfing pattern, and the overall bullish structure is established. Since price has already reached the prior high-resistance zone of the long upper wick and there is heavier selling pressure overhead, it’s recommended to take profit here and lock in most of the gains. There are two possible plans going forward: (1) if it strongly breaks above the previous high directly, hold the remaining position or add on strength; (2) if price pulls back to around $0.85 (near the top edge of the consolidation box, combined with the SMA21/EMA21 gap area), you can buy in batches on the pullback.

Solana (SOL): SOL’s large-scale bullish formation is very clear—there is a weekly bullish engulfing pattern accompanied by strong volume. The expected pullback has not fully reached the Fibonacci 0.5–0.618 levels and the Vegas channel (roughly the $105–$107 range). For now, the strategy is to stay patient. If, on smaller timeframes, a second round of structural oversold conditions appears and price falls into the $105–$107 support band, that would be an excellent opportunity to buy in batches.
ENA (Ethena): ENA has been extremely wild, decisively breaking the RSI bearish divergence and the bear-market indicators, directly pushing through the daily 200-day moving average. As a yield-from-collateral asset, its flywheel effect can deliver very strong profit-spike potential during bullish consolidation phases (as previously pinpointed in public community guidance around $0.15 for accurate accumulation). Currently, the price is far away from the 21-day moving average and is in an overbought zone—do not blindly chase. Consider waiting for a pullback to prior support structure lows on smaller timeframes and the 21-day moving average, and only start positioning after oversold signals appear on the 4-hour/1-hour charts.
Dogecoin (DOGE): DOGE’s rebound is relatively weak. The weekly chart has not achieved a bullish engulfing pattern. It is currently repeatedly fighting near the daily 200-day moving average (around $0.13), still short of the weekly 200-day moving average. Before the larger overall picture becomes fully clear, don’t blindly bet on a catch-up rally logic. If the broader market later experiences a deep pullback (for example, Bitcoin dips back toward $72,000 to form a base), then DOGE will have a chance to deliver a standout catch-up burst.
Ripple (XRP): On smaller timeframes, XRP has a slightly missing last step on a 1-hour pullback to the Vegas channel and the 21-day moving average—it has not triggered standard overbought or oversold conditions yet. Overall, it still looks favorable for the potential to hit the structural high near $1.45. However, if it rebounds close to the high point, it’s also recommended to take partial profits first and lock in gains.
❀❀END❀❀