📢📢📢〽️〽️〽️
26.09.21 Clear
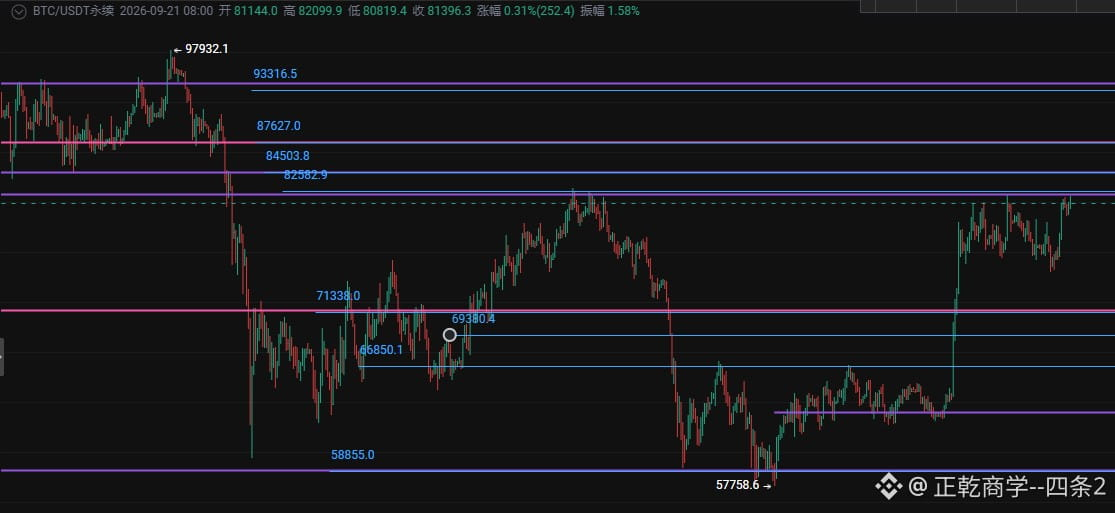
BTC/ETH weekly chart opening shows shrinking volume with an upward move. On lower timeframes, momentum is weak, and on the monthly timeframe there is an “invisible” (hidden) bearish/pressure signal. In the higher-level pressure zone, BTC: 825-833 / ETH: 2705-2727 meets resistance. If BTC breaks above 836 with a bullish candle, then pulls back but fails to break below 815-822, and holds above—then we could continue moving upward, standing above 860 to look at 876-935; possibly even higher. For ETH: if a bullish candle breaks above 2755, then the pullback to 2705-2727 holds (does not break), then it can continue upward, holding above 2791 to target around 2820. If it cannot hold, it would be a bull trap, leading to a deep pullback.
My personal bias is high selling, low buying. The reasons are simple: volume is insufficient for a rally, the monthly timeframe shows the “invisible” signal, and October starts high but turns lower.
BTC: Take the first position at 820 to prevent missing the breakout—risk 1%. Add at 842-855, 1% more. Add the third position at 876, 3%. Stop-loss: 93500.
ETH: Take the first position at 2727-2755 to prevent missing the breakout—risk 1%. Add at 2773-2791, 1% more. Add the third position around 2820, 3%. At each level, if large bearish candles appear, add positions in the direction of the move—wait to “eat the meat,” and hold long-term, waiting for BTC: 530-462; and a spike down to 350. For ETH: 1328-1196, spike down to 1070.
#以太坊突破2700美元
26.09.21 Clear
BTC/ETH weekly chart opening shows shrinking volume with an upward move. On lower timeframes, momentum is weak, and on the monthly timeframe there is an “invisible” (hidden) bearish/pressure signal. In the higher-level pressure zone, BTC: 825-833 / ETH: 2705-2727 meets resistance. If BTC breaks above 836 with a bullish candle, then pulls back but fails to break below 815-822, and holds above—then we could continue moving upward, standing above 860 to look at 876-935; possibly even higher. For ETH: if a bullish candle breaks above 2755, then the pullback to 2705-2727 holds (does not break), then it can continue upward, holding above 2791 to target around 2820. If it cannot hold, it would be a bull trap, leading to a deep pullback.
My personal bias is high selling, low buying. The reasons are simple: volume is insufficient for a rally, the monthly timeframe shows the “invisible” signal, and October starts high but turns lower.
BTC: Take the first position at 820 to prevent missing the breakout—risk 1%. Add at 842-855, 1% more. Add the third position at 876, 3%. Stop-loss: 93500.
ETH: Take the first position at 2727-2755 to prevent missing the breakout—risk 1%. Add at 2773-2791, 1% more. Add the third position around 2820, 3%. At each level, if large bearish candles appear, add positions in the direction of the move—wait to “eat the meat,” and hold long-term, waiting for BTC: 530-462; and a spike down to 350. For ETH: 1328-1196, spike down to 1070.
#以太坊突破2700美元