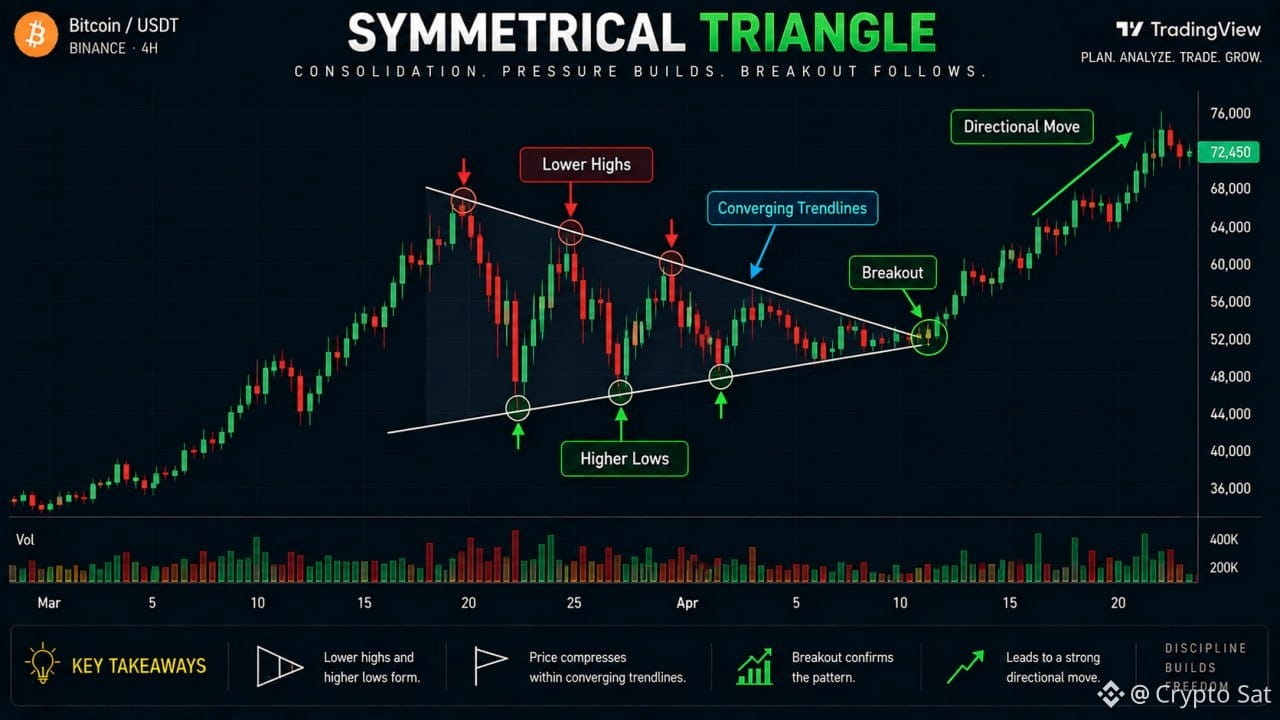
🔺 Symmetrical Triangle Pattern
Ever noticed Bitcoin making lower highs and higher lows until the price range becomes tighter and tighter?
That’s a Symmetrical Triangle.
A Symmetrical Triangle forms when neither buyers nor sellers have full control. Price keeps getting squeezed between falling resistance and rising support.
🔹 1️⃣ Lower Highs + Higher Lows
The structure is simple:
• Each rally reaches a lower high.
• Each pullback finds a higher low.
For example:
$BTC moves to $100K → pulls back to $92K
Then $98K → pulls back to $94K
Then $97K → pulls back to $95K
The highs are falling, while the lows are rising.
Eventually, the two trendlines move toward each other and create a triangle.
2️⃣ Volatility Starts Contracting
Inside the triangle, price swings usually become smaller and tighter.
Why?
Because buyers are stepping in at higher prices, while sellers are willing to sell at lower prices.
The market enters a period of compression. ⚡️
This doesn't tell us the breakout direction by itself.
3️⃣ Breakout Direction Matters
Eventually, price may break out of the triangle.
📈 Upside breakout: Buyers could be taking control, potentially continuing bullish momentum.
📉 Downside breakout: Sellers could be taking control, potentially starting a bearish move.
The key is not assuming the direction beforehand.
🚨 Wait for Confirmation
A simple wick outside the triangle isn't enough.
Look for:
▪️ Strong candle close outside the pattern
▪️ Supporting volume
▪️ Retest and successful hold
▪️ Market structure confirmation
Remember: Compression creates the setup.
The breakout reveals the direction.
Confirmation validates the move.
Don't guess which side will break. Let price show you. 🚀
Ever noticed Bitcoin making lower highs and higher lows until the price range becomes tighter and tighter?
That’s a Symmetrical Triangle.
A Symmetrical Triangle forms when neither buyers nor sellers have full control. Price keeps getting squeezed between falling resistance and rising support.
🔹 1️⃣ Lower Highs + Higher Lows
The structure is simple:
• Each rally reaches a lower high.
• Each pullback finds a higher low.
For example:
$BTC moves to $100K → pulls back to $92K
Then $98K → pulls back to $94K
Then $97K → pulls back to $95K
The highs are falling, while the lows are rising.
Eventually, the two trendlines move toward each other and create a triangle.
2️⃣ Volatility Starts Contracting
Inside the triangle, price swings usually become smaller and tighter.
Why?
Because buyers are stepping in at higher prices, while sellers are willing to sell at lower prices.
The market enters a period of compression. ⚡️
This doesn't tell us the breakout direction by itself.
3️⃣ Breakout Direction Matters
Eventually, price may break out of the triangle.
📈 Upside breakout: Buyers could be taking control, potentially continuing bullish momentum.
📉 Downside breakout: Sellers could be taking control, potentially starting a bearish move.
The key is not assuming the direction beforehand.
🚨 Wait for Confirmation
A simple wick outside the triangle isn't enough.
Look for:
▪️ Strong candle close outside the pattern
▪️ Supporting volume
▪️ Retest and successful hold
▪️ Market structure confirmation
Remember: Compression creates the setup.
The breakout reveals the direction.
Confirmation validates the move.
Don't guess which side will break. Let price show you. 🚀