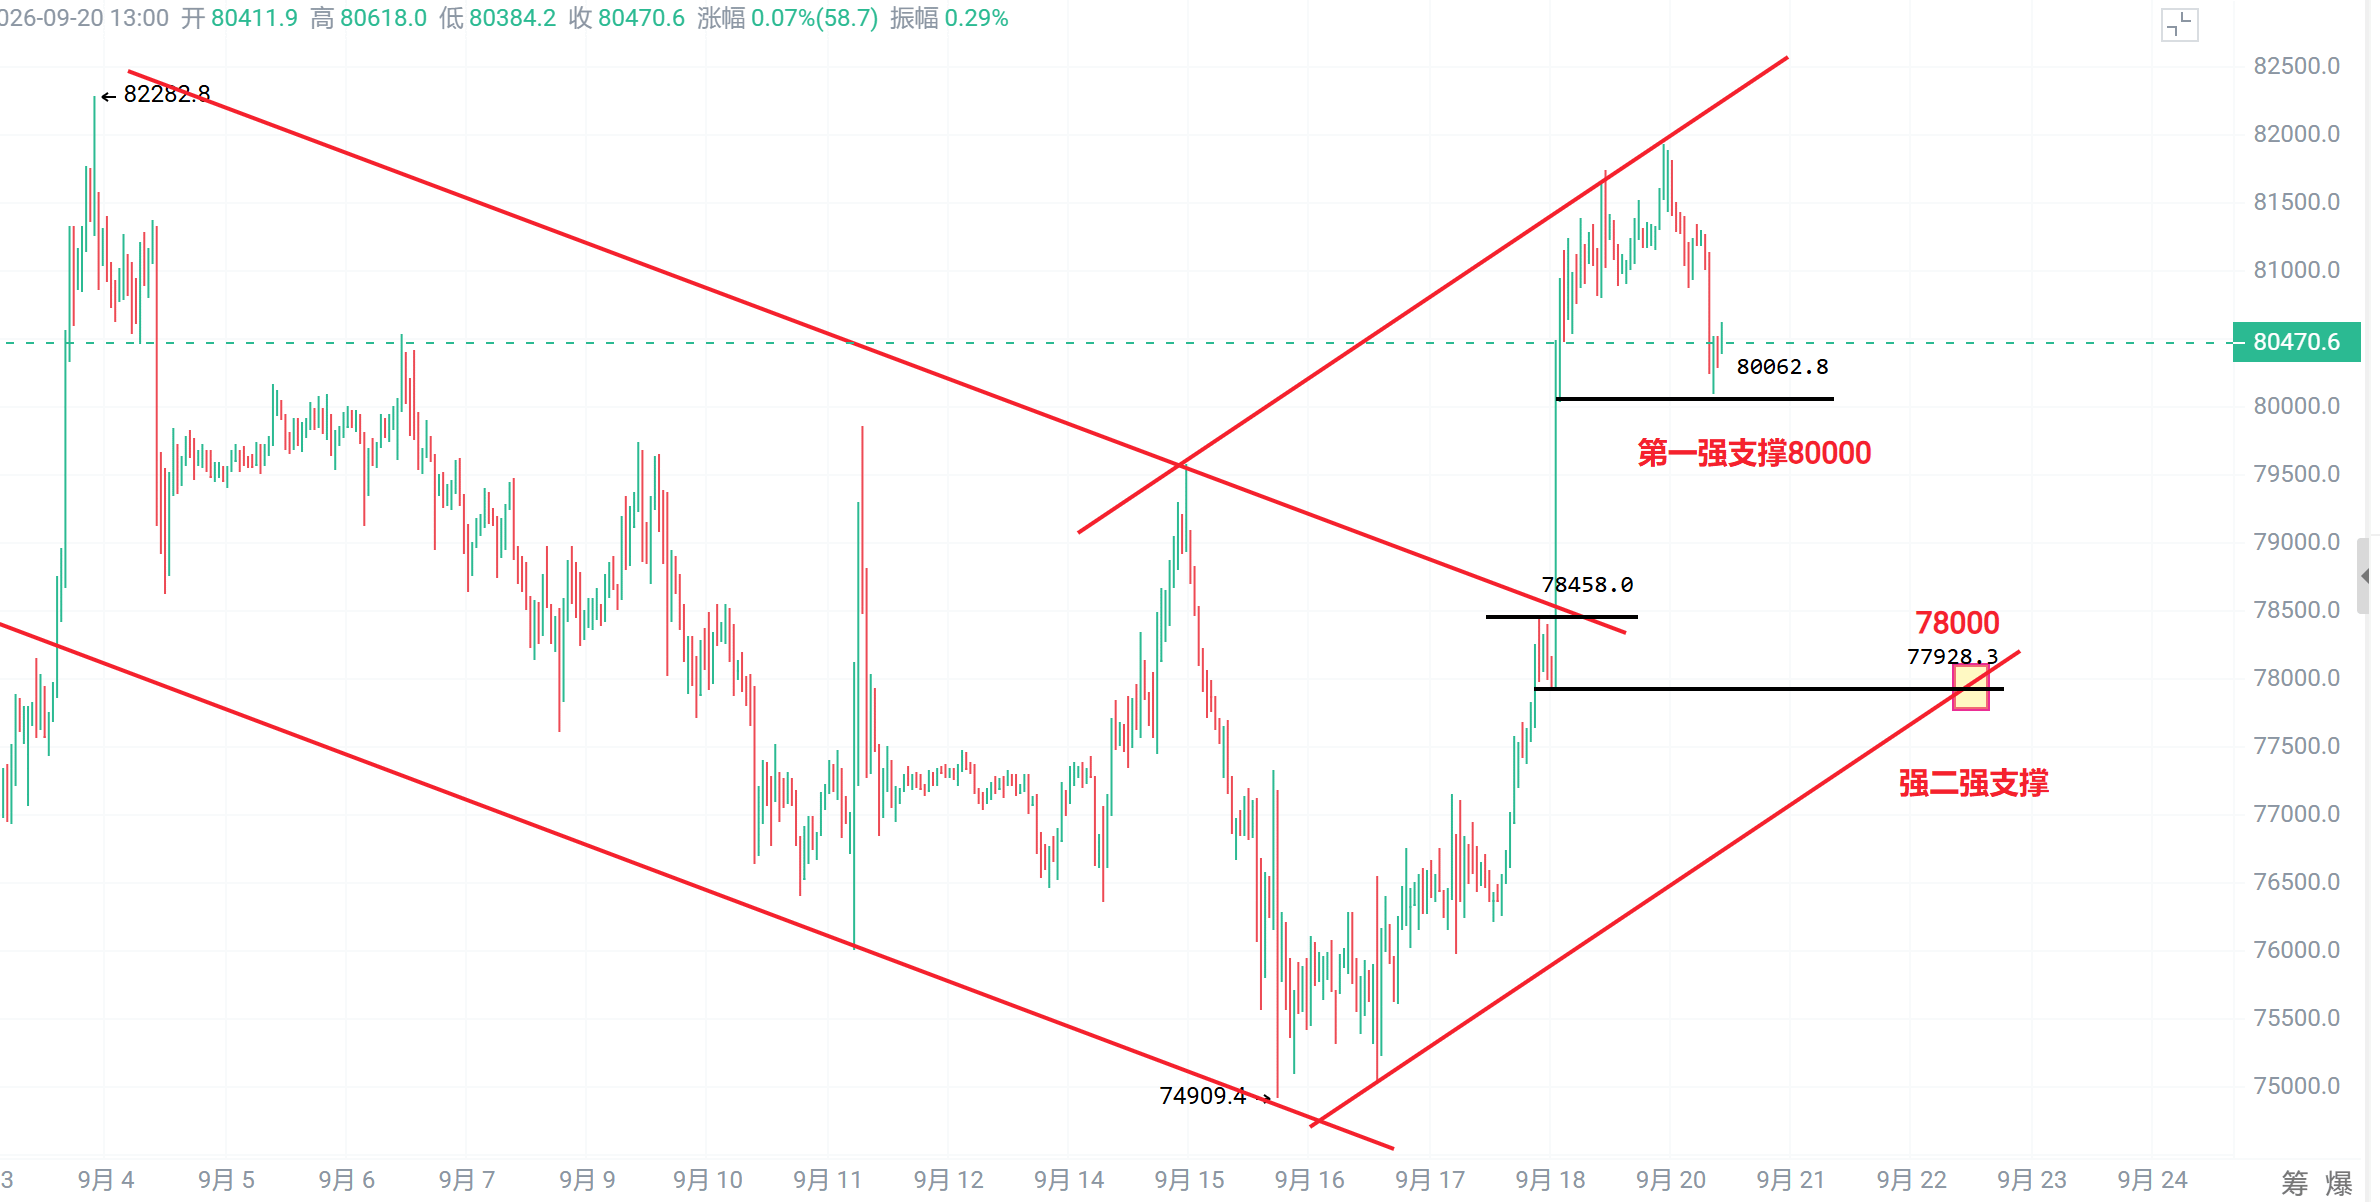
$BTC market this week the highest point of the rise is 81,900 points; the high in September is 82,200, and the pullback high in May is 82,800. In general, the whole market is basically stuck in the 82,000–83,000 range. Only if it breaks above 83,000 and holds, can the whole market be considered firmly established. That would mean the market has shifted from a bear-market decline to an upward trend.
On Friday, Zhuang made a bull trap/false breakout around 80,000–80,500. After that, it kept consolidating above 80,500. After a short-term repair, bullish momentum did not form another big surge. After consolidating in the upper range, the 81,900 pullback slid back to 80,000, a strong support point, which also broke the support around 80,500 from Friday and moved down to 80,000.
We must think independently about this detail:
If the new high was not broken, and if Friday’s 80,500 support was broken, yet it did not break below 80,000, then first consider that the shorts who were trapped in the 80,000–80,500 area on Friday are definitely many and they would be afraid to withdraw too late before a new high breaks out. So instead of clearing out all at once, they likely entered shorts in batches. There are also many who played the trend with 80,000–80,500 as the lead position. Since a new high was not broken, long positions at the high are likely fewer; more longs would likely be placed around 80,000, with stop-losses to test one trade.
The shorts that entered in batches are likely already in profit at this time. A long with a stop-loss attempt near 80,000 is also relatively controllable in terms of risk/reward. And institutions don’t have a good opportunity for a large-scale “harvest” right now.
Now look at the chart: it’s simply two strong supports—80,000 and 78,000. Will institutions choose to break 80 and move toward 78, then turn upward in the middle? Or will they hold at 80 and rebound upward? Or will price fall to 78 and then bottom out and rebound?
I think the most operationally practical and cost-effective scenario is: once it breaks 8 (80,000), it makes a sudden hard stop and then rebounds sharply on the way to 78.
From indicators: currently, the pullback has already repaired the hourly line and the 4-hour medium-term indicators, but it has not yet formed a bullish pattern. As for the market’s bullish view, the pullback position will only keep getting higher.
Overall analysis: at 80,000, you can take a short-term long. Move the stop-loss down by 200 points. If it breaks below that, then above 78,000 you can place positions in batches. The final liquidation (stop-out) should not be higher than 70,000. Ride the trend. From the chart, 78,000 is the lowest point of this pullback, but most likely it will not reach there.
The above is my personal analysis and suggestions. Please refer to it cautiously!!! #行情分析📈
On Friday, Zhuang made a bull trap/false breakout around 80,000–80,500. After that, it kept consolidating above 80,500. After a short-term repair, bullish momentum did not form another big surge. After consolidating in the upper range, the 81,900 pullback slid back to 80,000, a strong support point, which also broke the support around 80,500 from Friday and moved down to 80,000.
We must think independently about this detail:
If the new high was not broken, and if Friday’s 80,500 support was broken, yet it did not break below 80,000, then first consider that the shorts who were trapped in the 80,000–80,500 area on Friday are definitely many and they would be afraid to withdraw too late before a new high breaks out. So instead of clearing out all at once, they likely entered shorts in batches. There are also many who played the trend with 80,000–80,500 as the lead position. Since a new high was not broken, long positions at the high are likely fewer; more longs would likely be placed around 80,000, with stop-losses to test one trade.
The shorts that entered in batches are likely already in profit at this time. A long with a stop-loss attempt near 80,000 is also relatively controllable in terms of risk/reward. And institutions don’t have a good opportunity for a large-scale “harvest” right now.
Now look at the chart: it’s simply two strong supports—80,000 and 78,000. Will institutions choose to break 80 and move toward 78, then turn upward in the middle? Or will they hold at 80 and rebound upward? Or will price fall to 78 and then bottom out and rebound?
I think the most operationally practical and cost-effective scenario is: once it breaks 8 (80,000), it makes a sudden hard stop and then rebounds sharply on the way to 78.
From indicators: currently, the pullback has already repaired the hourly line and the 4-hour medium-term indicators, but it has not yet formed a bullish pattern. As for the market’s bullish view, the pullback position will only keep getting higher.
Overall analysis: at 80,000, you can take a short-term long. Move the stop-loss down by 200 points. If it breaks below that, then above 78,000 you can place positions in batches. The final liquidation (stop-out) should not be higher than 70,000. Ride the trend. From the chart, 78,000 is the lowest point of this pullback, but most likely it will not reach there.
The above is my personal analysis and suggestions. Please refer to it cautiously!!! #行情分析📈