
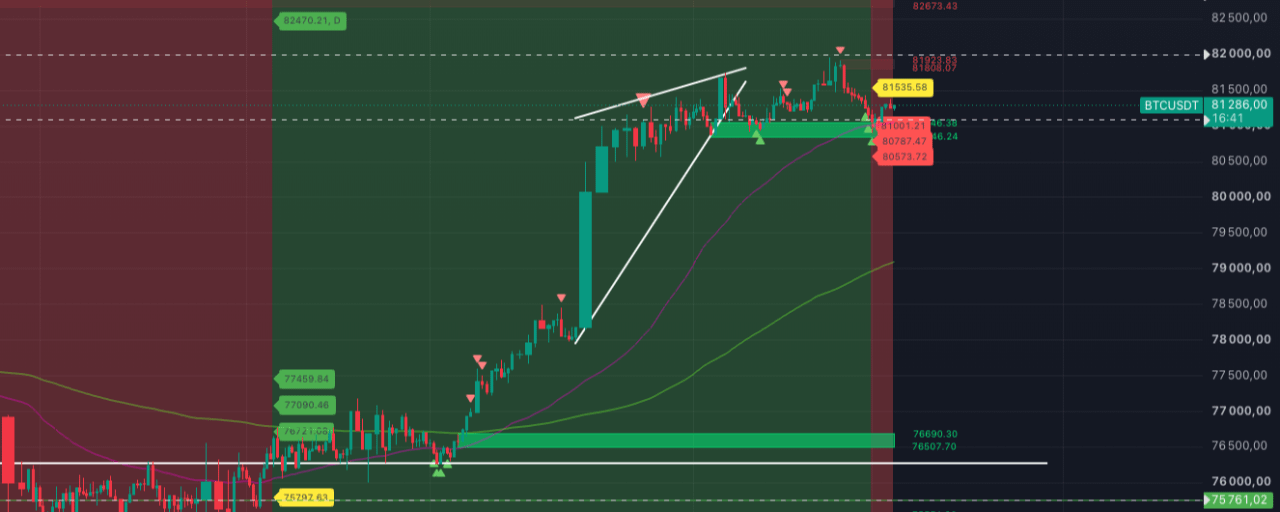


For BTC — a new add to a short position, with sustained downtrends on the 15- and 30-minute time frames. Both are the first ones after the pump on September 18.
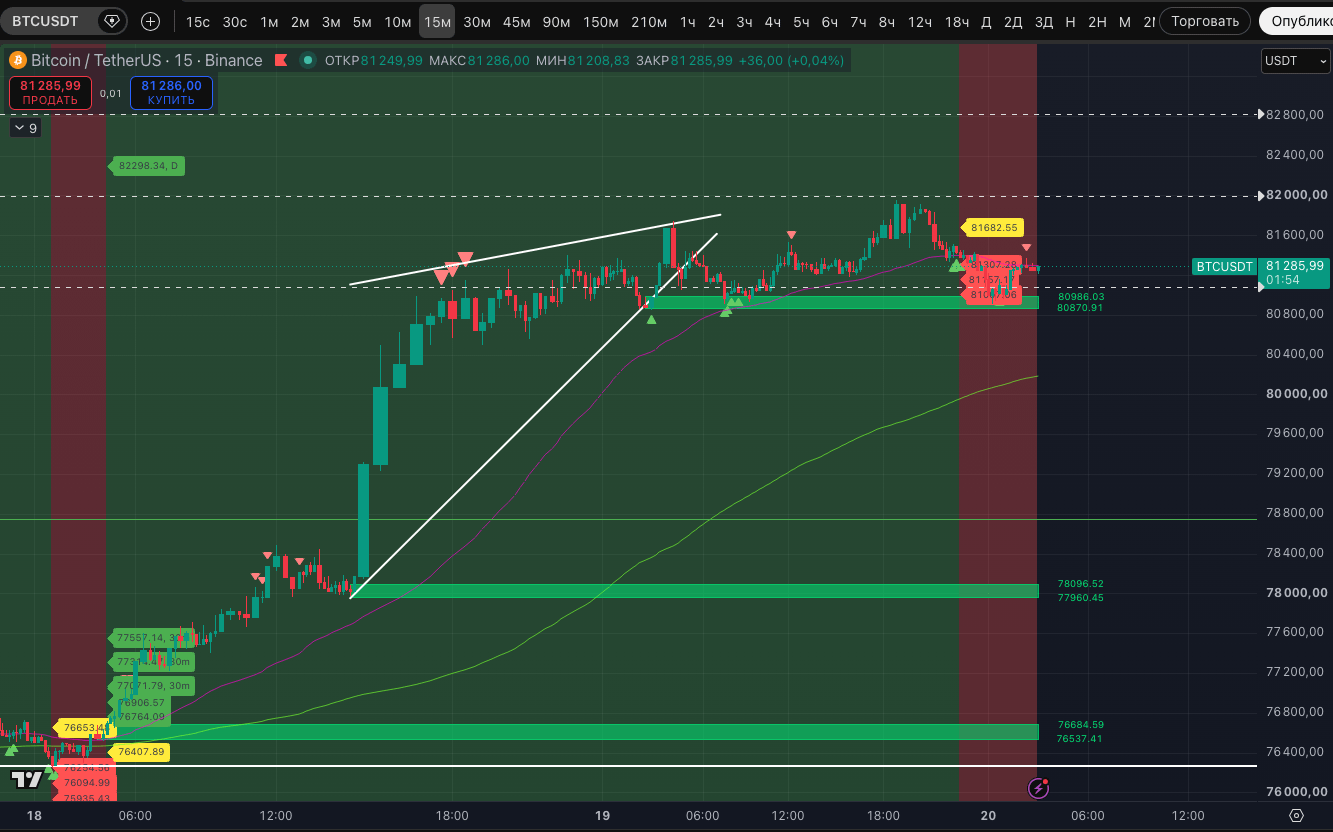
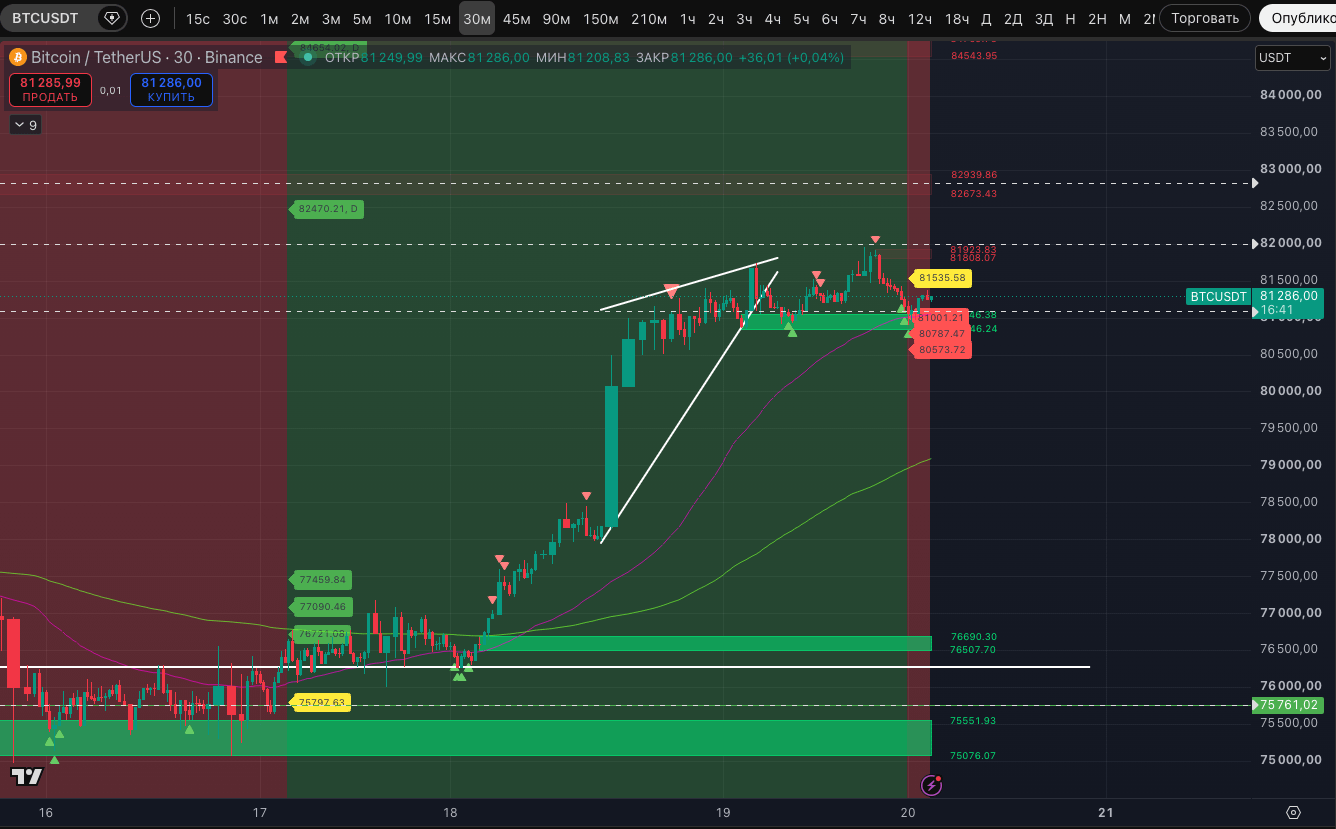
Several times in past posts it was said that the next attempt would be at the breakout + after a correction and a sustained downtrend on the 15-minute time frame. After the new local high of $81,951, the decline started actively and downtrends were obtained right on both of the mentioned time frames. Therefore, from its support at $80,904 and the marks of a potential support level on the 30-minute time frame, we waited for a rebound and added a position now. Additionally, in doing so, liquidity was replenished into the position.
In the end, we have the following picture—the entry price is $77,780.17, the break-even level (taking into account two unsuccessful short add-ons that were eventually closed) is $75,622.01. The liquidation level is $85,456.62.
If the price breaks the downtrend on the 30-minute timeframe, we will close this short add-on and wait again for opportunities to short. Until then—definitely hold; it’s about time for the sellers to show themselves.
At the same time, if the correction shows continuation, we can also make one more short position add-on when transitioning into a sustained downtrend on the 3-hour timeframe.
Right now, all attention is on the ability of the bulls to move the price into a sustained uptrend on the weekly timeframe. Based on the candle close during the night from Sunday to Monday. If the downtrend is broken, then, in our assessment, Bitcoin will enter a bull market—with corresponding risks for shorts, both short-term and medium- and long-term. Our calculation is that during the pullback the market will provide an opportunity to close the current short.
Based on extreme signals from Friday’s breakdowns, we have the following picture:
- new markers of a potential high on the 1-hour timeframe (after a slight higher high on the Strong signal),
- a new marker of a potential high on the 2-hour timeframe (also after a slight higher high on the Strong signal),
- the fourth additional marker after the Strong signal of a potential high on the 3-, 4-, and 5-hour timeframe (in the second and third cases, the price got stuck in liquidity zones as resistances),
- there are three markers of a potential high on the 8-hour timeframe.
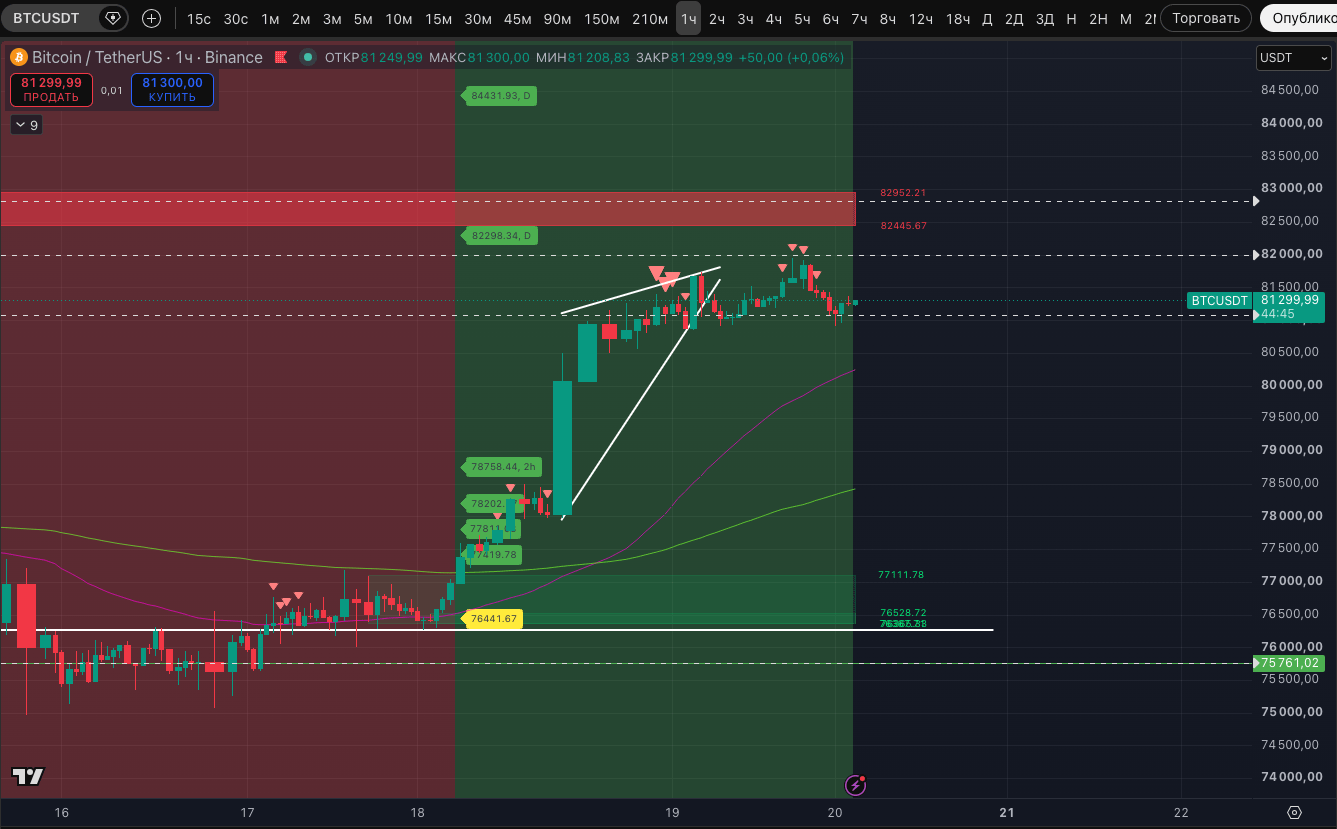
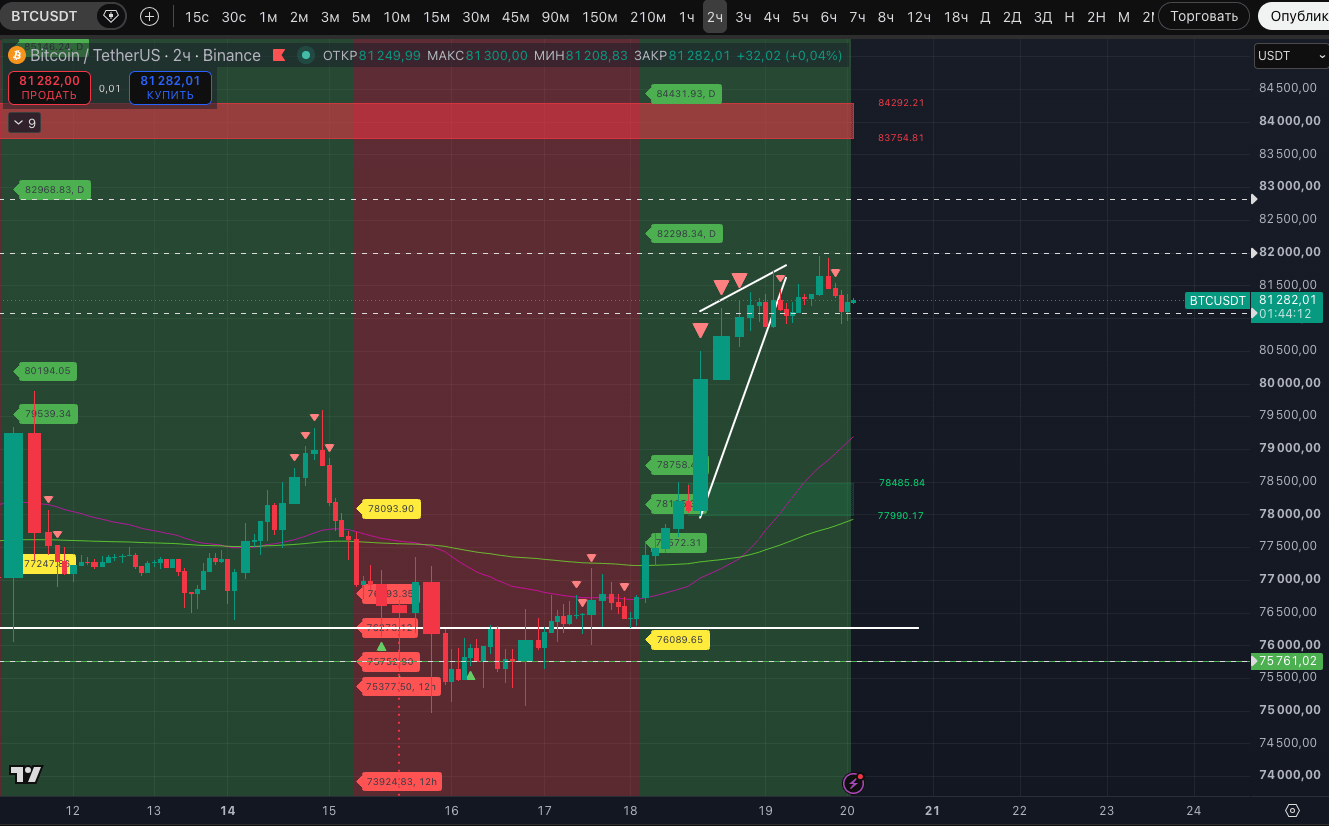
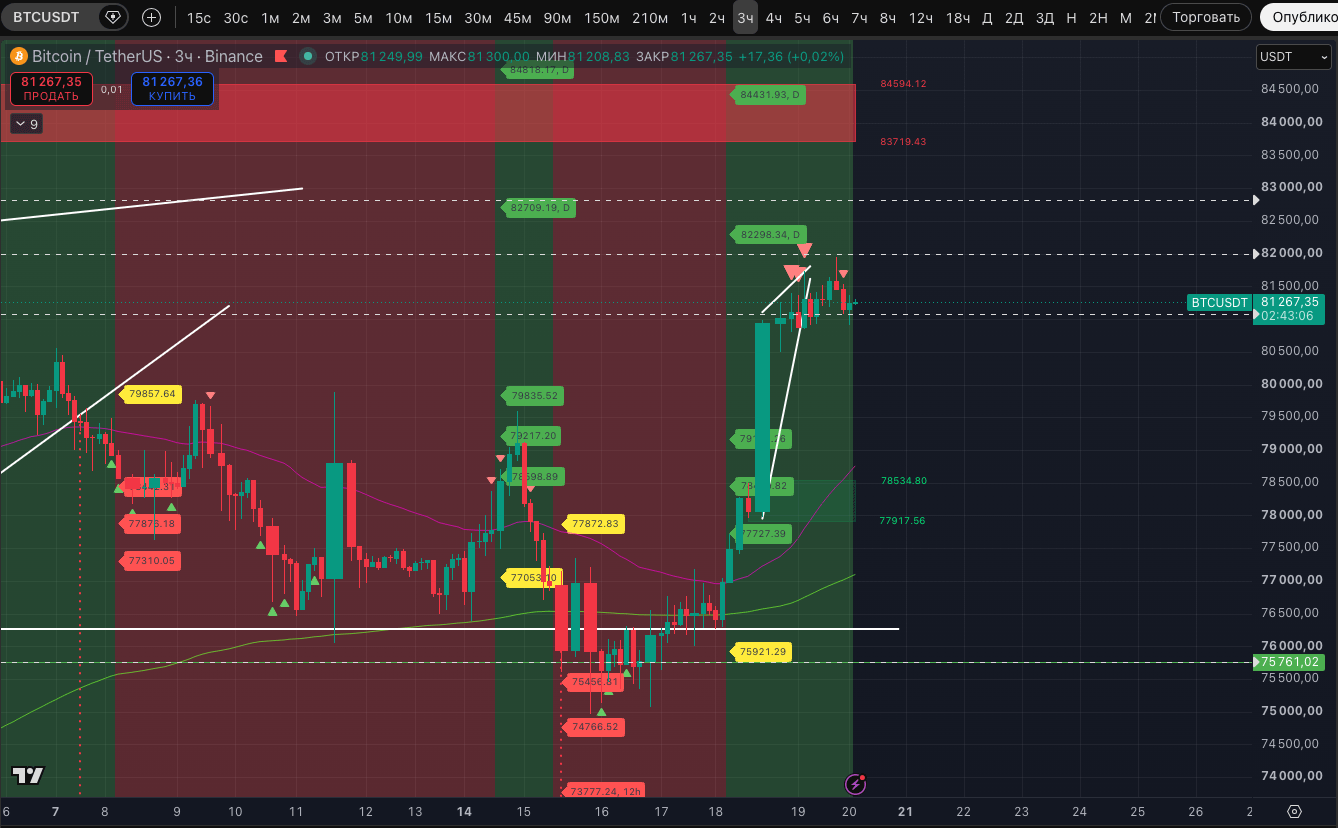
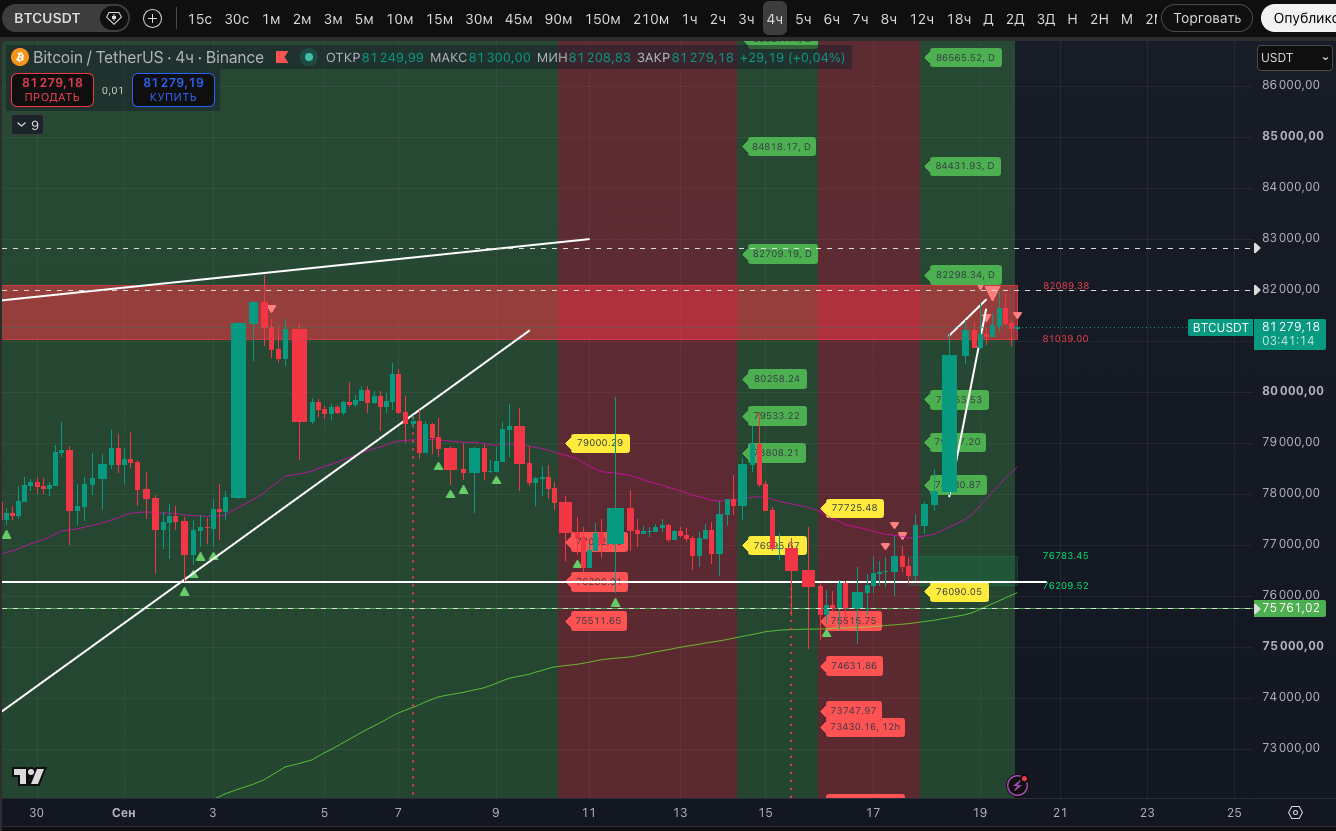
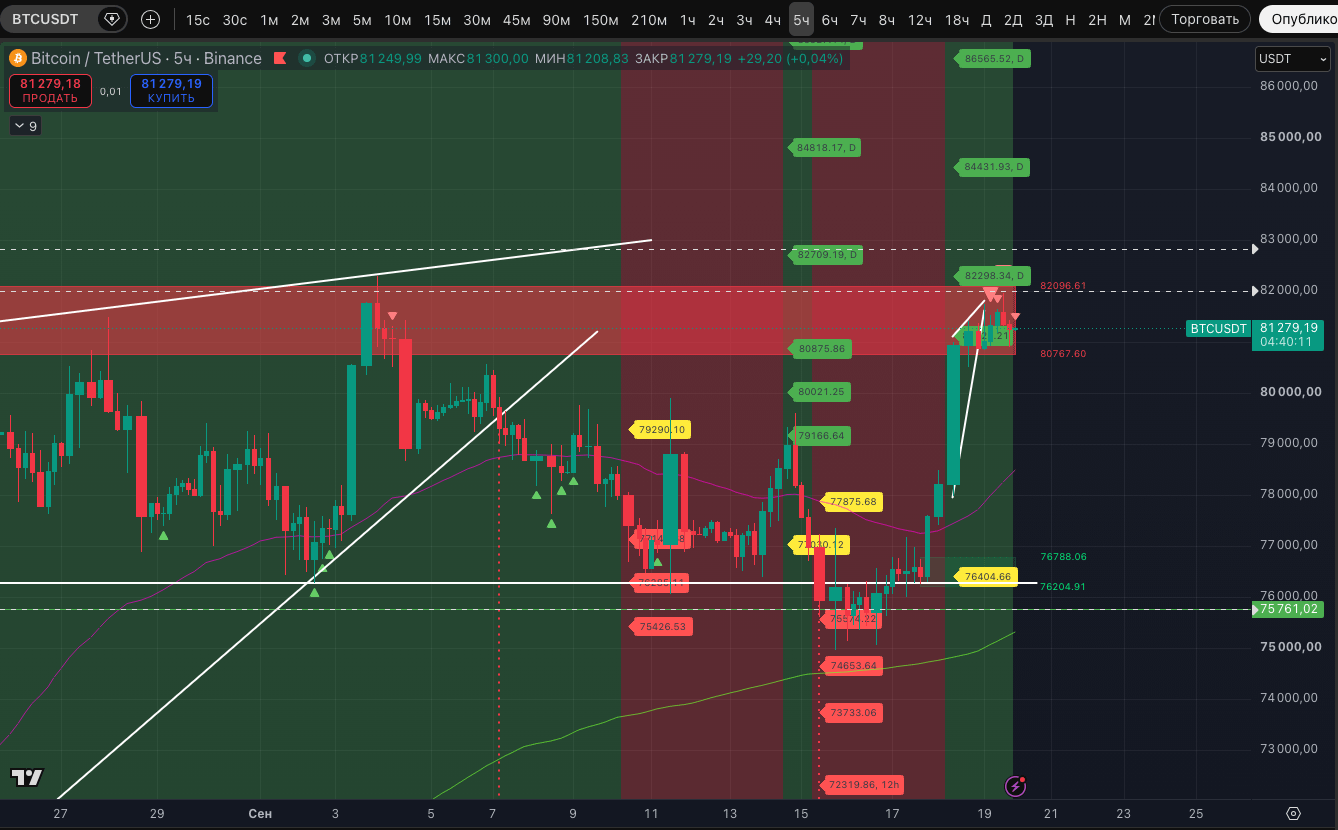
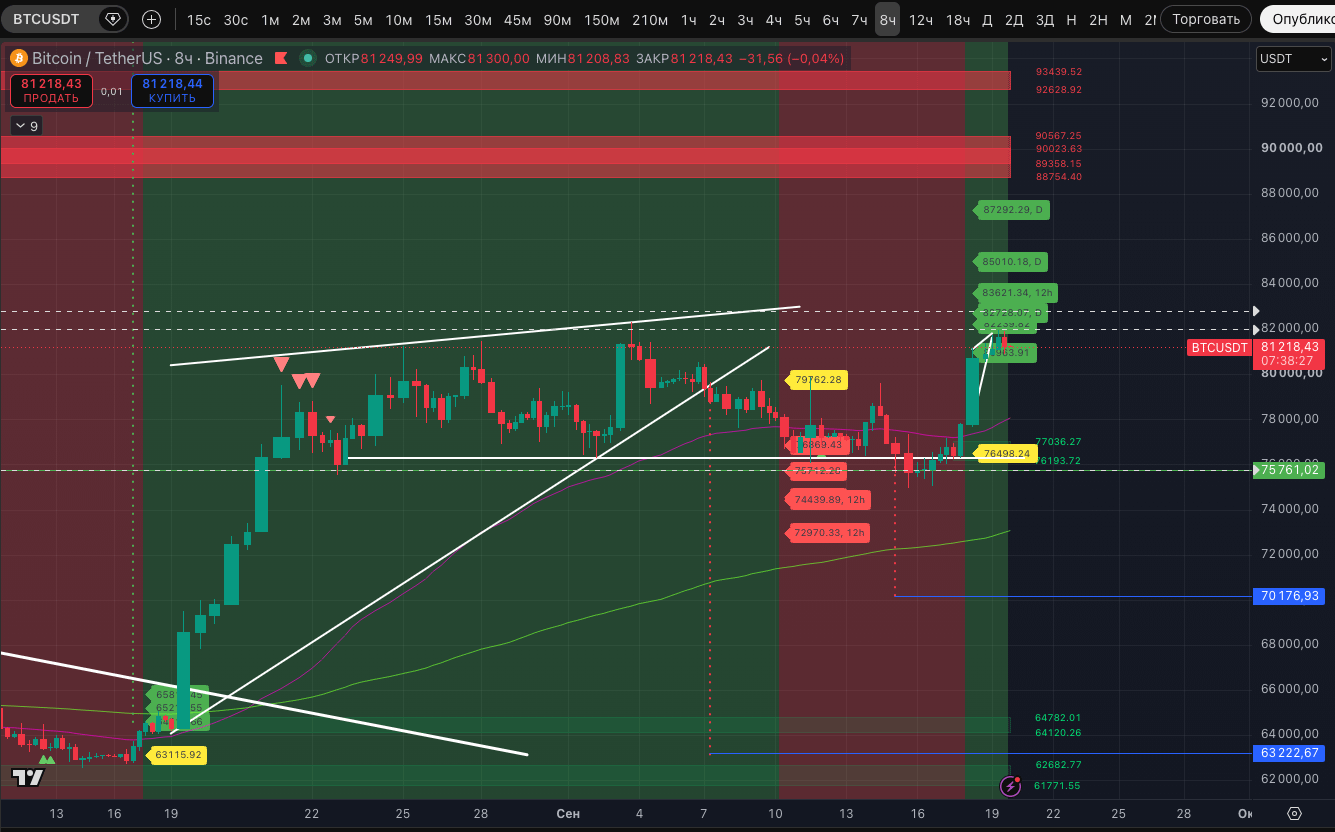
The history is the same as in the last few days—based on the extremes, there are many signals suggesting a move downward. BUT it’s important to get confirmation of a reversal at least by the trend on lower timeframes. For now, confirmation exists on the 30-minute timeframe, as was said at the beginning of the post. Not super reliable, but sufficient to attempt a short—which is what we’re using.