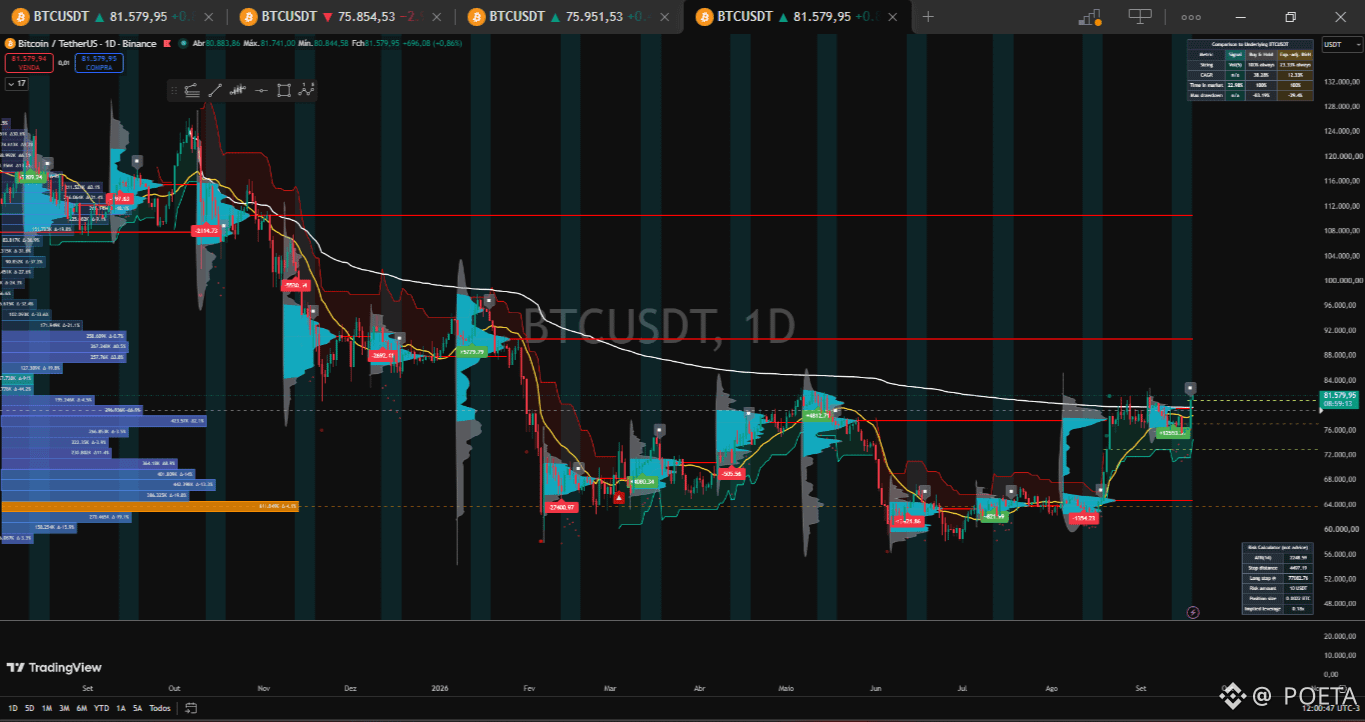
The BTCUSDT chart on the daily timeframe shows a recovery moment, accompanied by different flow, trend, and volume tools. The price, currently in the 81,579.95 region, managed to break above the yellow Flow average and also the most recent monthly POC, located approximately between 76 and 78 thousand dollars. This staying above those references suggests that the market is accepting higher prices.
At the same time, the Volume Profile shows the main areas where trading was concentrated and makes it possible to identify levels that could act as support or resistance. Above the current price there are still important POCs, mainly in the regions near 88 thousand and 108 thousand dollars. Therefore, although the recent move shows signs of recovery, there are still relevant levels that may hinder a direct continuation of the rally.
The main point is that BTC is trying to turn a recovery into a more consistent bullish structure. However, the previous drop, from approximately 120 thousand to 60 thousand dollars, is still part of the broader context and indicates that the larger structure has not been fully reversed. Thus, the current scenario can be interpreted as a recovery within a structure that still needs to confirm its trend change.
The indicator reading favors, at this moment, a sideways upward continuation as long as the price remains above the yellow average and the most recent monthly POC. On the other hand, losing these references could weaken this reading and put the price back into a correction phase.
In summary, the chart shows signs of recovery and a strengthening of price, but it still does not allow considering the structural change as fully confirmed. The next moves will depend mainly on BTC’s ability to remain above the volume regions recently achieved and, subsequently, to face the upper POCs.
At the same time, the Volume Profile shows the main areas where trading was concentrated and makes it possible to identify levels that could act as support or resistance. Above the current price there are still important POCs, mainly in the regions near 88 thousand and 108 thousand dollars. Therefore, although the recent move shows signs of recovery, there are still relevant levels that may hinder a direct continuation of the rally.
The main point is that BTC is trying to turn a recovery into a more consistent bullish structure. However, the previous drop, from approximately 120 thousand to 60 thousand dollars, is still part of the broader context and indicates that the larger structure has not been fully reversed. Thus, the current scenario can be interpreted as a recovery within a structure that still needs to confirm its trend change.
The indicator reading favors, at this moment, a sideways upward continuation as long as the price remains above the yellow average and the most recent monthly POC. On the other hand, losing these references could weaken this reading and put the price back into a correction phase.
In summary, the chart shows signs of recovery and a strengthening of price, but it still does not allow considering the structural change as fully confirmed. The next moves will depend mainly on BTC’s ability to remain above the volume regions recently achieved and, subsequently, to face the upper POCs.