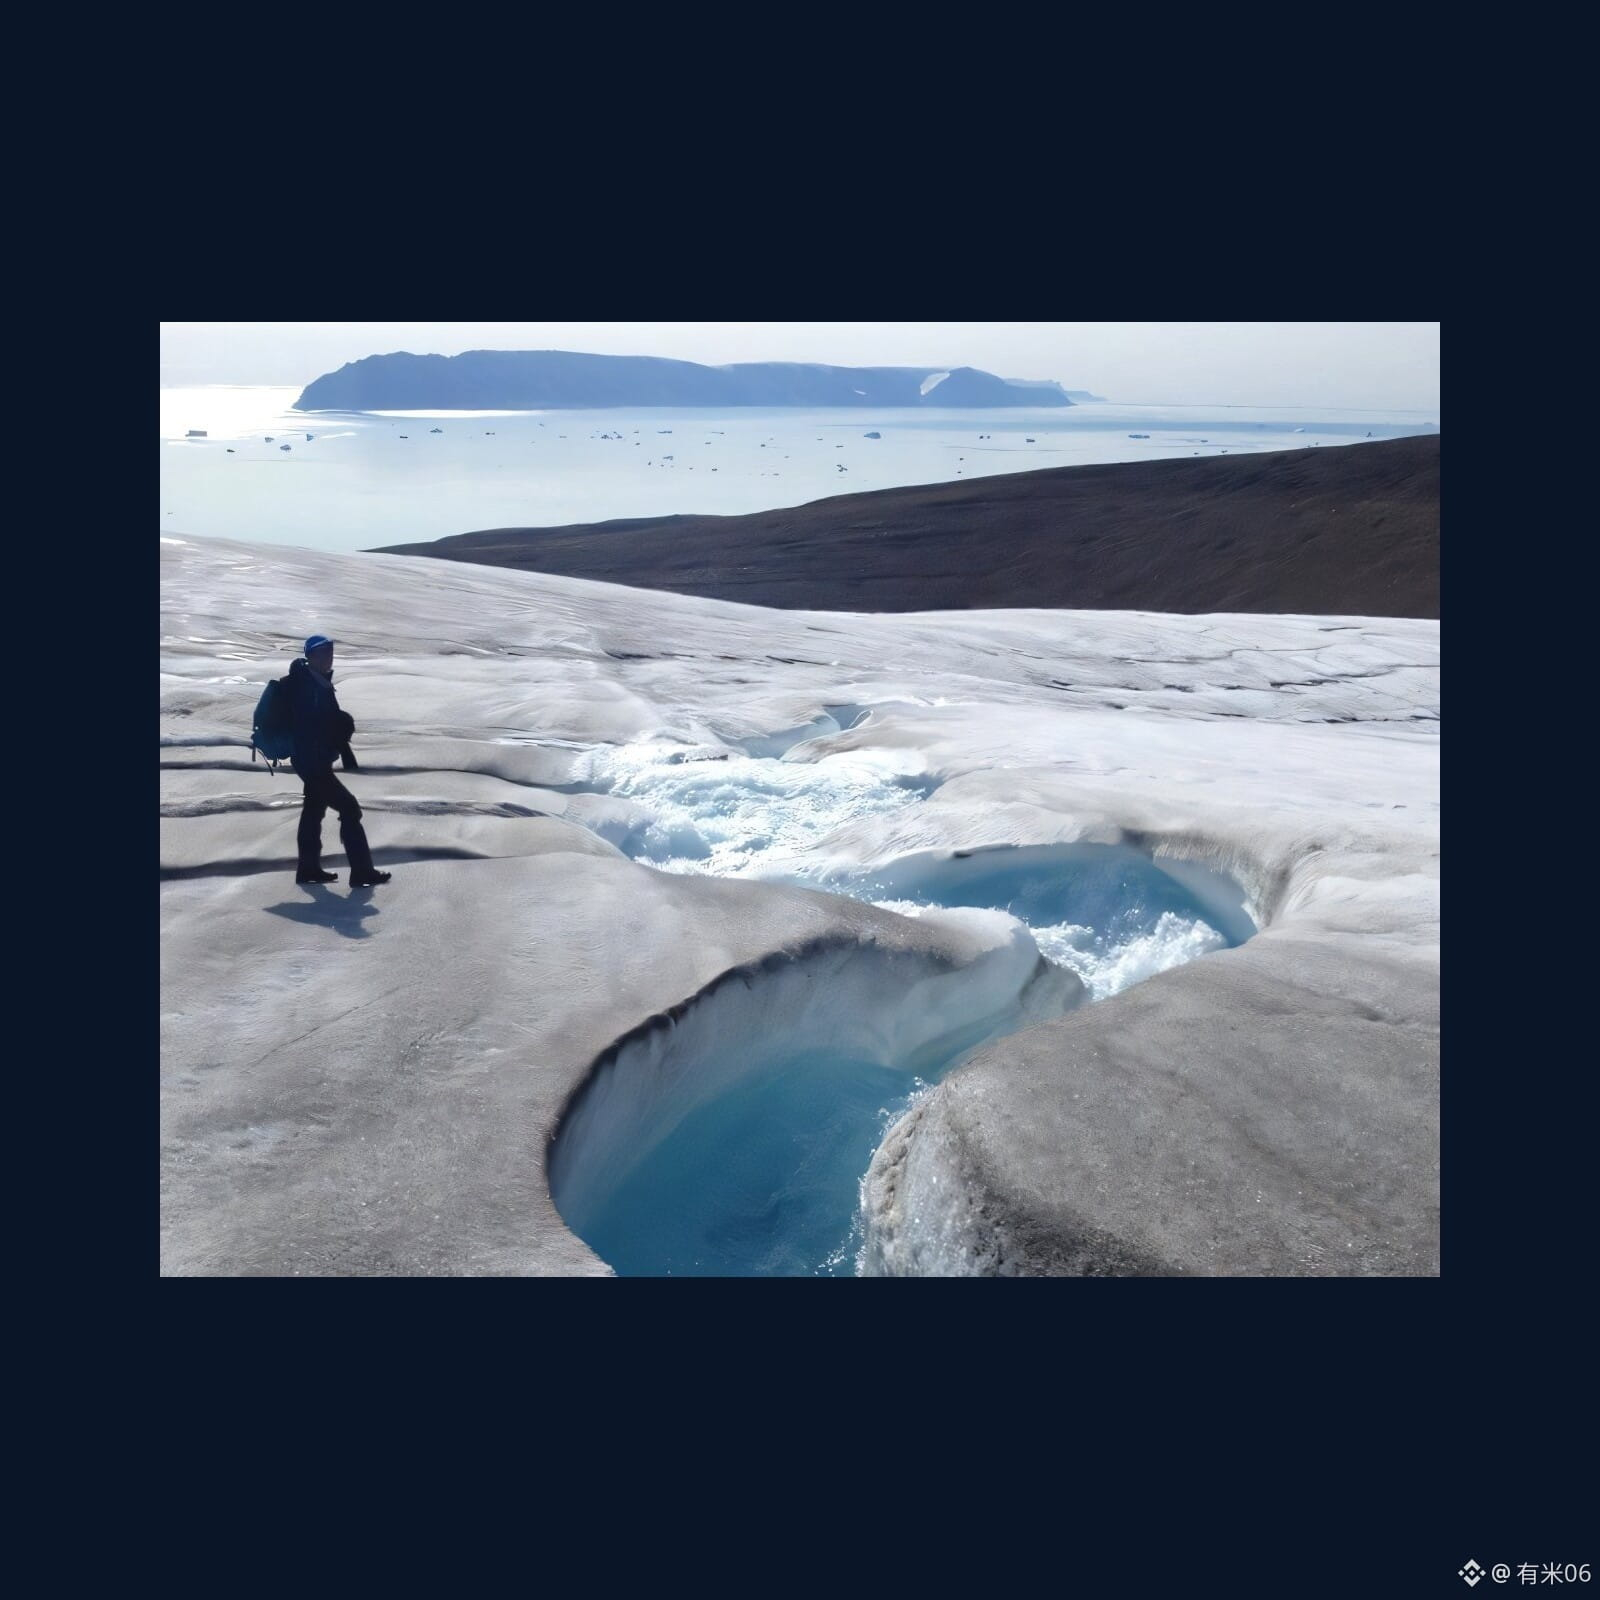
Instant takeaway: The Greenland northwest Qaanaaq ice cap—along with the University of Hokkaido and others—fixed 13 years’ worth of aluminum rods, spanning 2012–2025. The entire-cap mass balance is about −8.01±0.22 m in water equivalent. Along outlet glaciers, the surface average decline is about 8.7 m, and thinning in the low-elevation sections is still accelerating.
In the Journal of Glaciology, long-term on-the-ground records are provided for the relatively rare northwest coast: six field stations along a flowline, plus about 280 elevation points and GPS on the rods. Horizontal flow speeds in the ablation zone drop by roughly 8%–64%. Thinning at low elevations (<500 m) accelerates from 2012–2019 to 2019–2025: about half of the change comes from weakened emergence velocity from “upward replenishment and downward supply,” while the other half reflects a more negative surface mass balance. At higher elevations (>800 m), emergence strengthens, roughly offsetting the more negative surface losses. A press release also notes: surrounding glaciers/ice caps account for only about 4% of Greenland’s ice area, yet they contribute roughly 14% of total ice loss in 2018–2021.
Figure: meltwater channels (Ken Kondo) + snow-pit depth sounding (Shin Sugiyama); original image from the University of Hokkaido press release—non-AI
Data as of: Journal of Glaciology online 2026-06-18; checked/reviewed by phys.org / University of Hokkaido press release
#冰川 #Greenland
In the Journal of Glaciology, long-term on-the-ground records are provided for the relatively rare northwest coast: six field stations along a flowline, plus about 280 elevation points and GPS on the rods. Horizontal flow speeds in the ablation zone drop by roughly 8%–64%. Thinning at low elevations (<500 m) accelerates from 2012–2019 to 2019–2025: about half of the change comes from weakened emergence velocity from “upward replenishment and downward supply,” while the other half reflects a more negative surface mass balance. At higher elevations (>800 m), emergence strengthens, roughly offsetting the more negative surface losses. A press release also notes: surrounding glaciers/ice caps account for only about 4% of Greenland’s ice area, yet they contribute roughly 14% of total ice loss in 2018–2021.
Figure: meltwater channels (Ken Kondo) + snow-pit depth sounding (Shin Sugiyama); original image from the University of Hokkaido press release—non-AI
Data as of: Journal of Glaciology online 2026-06-18; checked/reviewed by phys.org / University of Hokkaido press release
#冰川 #Greenland