$TRUMP
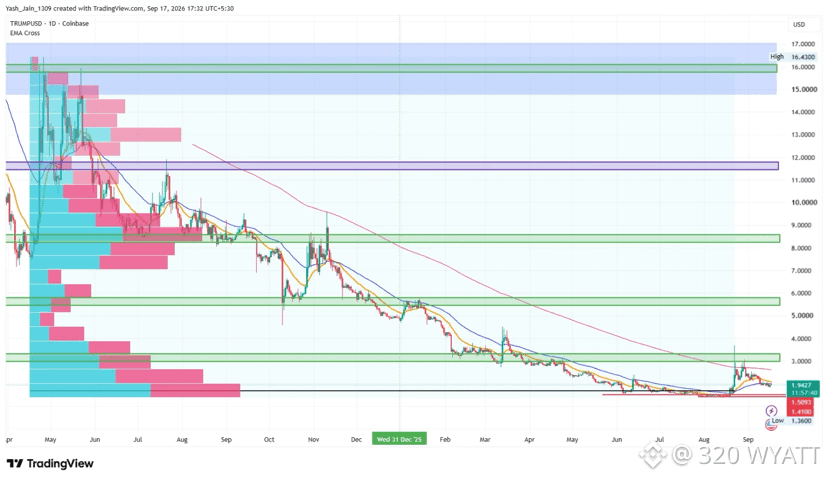
This structural decline became highly evident after the asset, which traded around the $5.50 to $5.70 range in January 2026, suffered a continuous markdown that pushed its price down to $1.50 by June, forcing a very muted close to the first half of the year.
As the second half of the year kicked off in July, expectations of bearish exhaustion surged among market participants who were eagerly awaiting a potential trend reversal.
From there, accumulation accelerated, as confirmed by the anchored volume profile metric, which showed a high institutional footprint in the $1.42 to $1.95 area. Alongside broader market optimism, TRUMP’s price staged a strong rally in August 2026.
It rallied to $3.65 and breached the 200-day EMA band in a single move. The price has retraced now after testing an important resistance block around $3.30. But it failed to sustain and pushed TRUMP’s price back under the 200-day EMA band and now risks a crash back toward $1.50.
However, this bullish momentum could continue if the price could rally higher toward $5.50, and in the months ahead, it could even target the next major institutional footprint area between $8.25 and $8.85.
#TRUMP #trump320 #Trendingissue #WriteToEarn2026 #mr320
This structural decline became highly evident after the asset, which traded around the $5.50 to $5.70 range in January 2026, suffered a continuous markdown that pushed its price down to $1.50 by June, forcing a very muted close to the first half of the year.
As the second half of the year kicked off in July, expectations of bearish exhaustion surged among market participants who were eagerly awaiting a potential trend reversal.
From there, accumulation accelerated, as confirmed by the anchored volume profile metric, which showed a high institutional footprint in the $1.42 to $1.95 area. Alongside broader market optimism, TRUMP’s price staged a strong rally in August 2026.
It rallied to $3.65 and breached the 200-day EMA band in a single move. The price has retraced now after testing an important resistance block around $3.30. But it failed to sustain and pushed TRUMP’s price back under the 200-day EMA band and now risks a crash back toward $1.50.
However, this bullish momentum could continue if the price could rally higher toward $5.50, and in the months ahead, it could even target the next major institutional footprint area between $8.25 and $8.85.
#TRUMP #trump320 #Trendingissue #WriteToEarn2026 #mr320