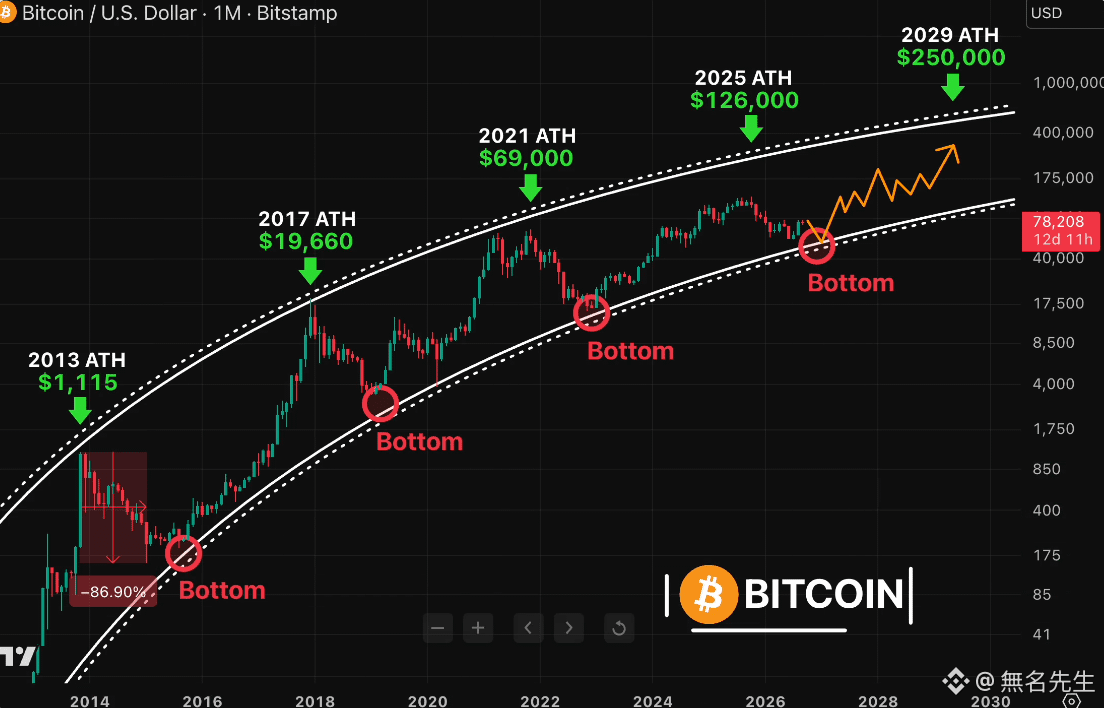
#BTC is using historical drawdown percentages as talking points. -86%, -84%, -77%, -61%—it looks systematic, but have you thought about this—there are only four samples?
Are four data points connected by a line considered a trend, or just coincidence? Each round has different macro conditions, liquidity, and participants. Judging that “this time it’s over for good” based on decreasing numbers is like a man trying to cross a river by the marks on his boat.
You can take the pattern as a reference, but don’t treat it as truth.
Are four data points connected by a line considered a trend, or just coincidence? Each round has different macro conditions, liquidity, and participants. Judging that “this time it’s over for good” based on decreasing numbers is like a man trying to cross a river by the marks on his boat.
You can take the pattern as a reference, but don’t treat it as truth.