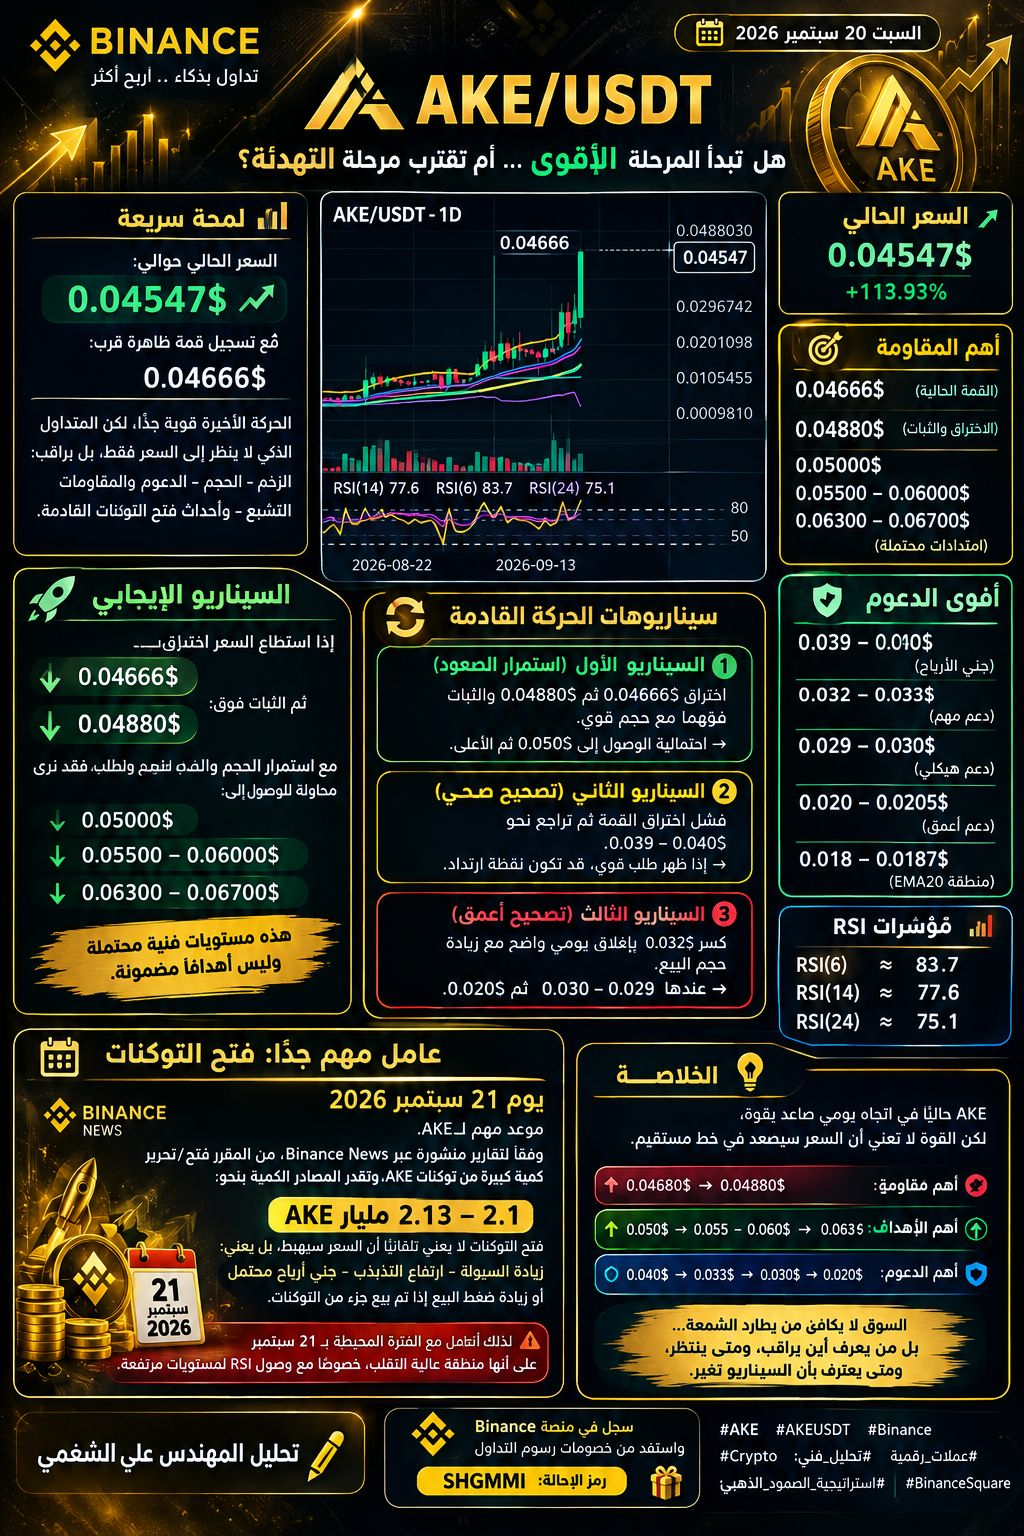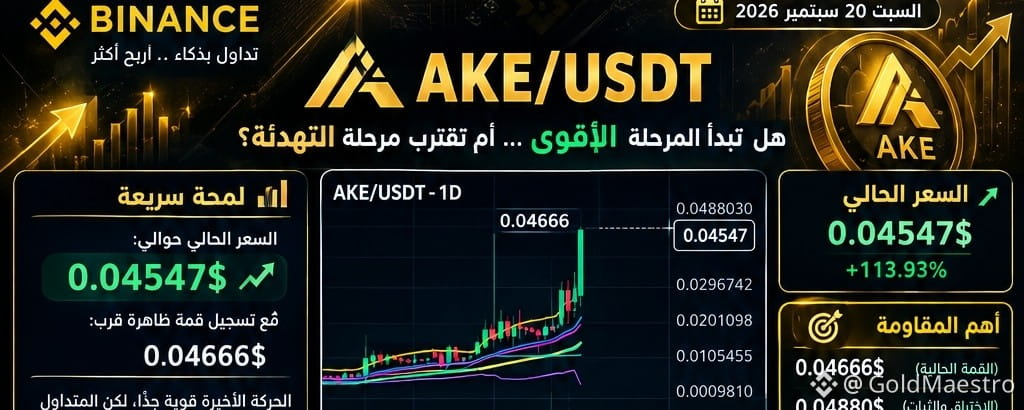

📊 Reading the daily timeframe for $AKE reveals a very strong movement in the recent period, and the price reached in the chart around:
💰 0.04547$
📈 With a clear peak recorded near 0.04666$
But the smart trader doesn’t look only at the price rise… they watch:
🔎 Momentum
🔎 Volume
🔎 Supports and resistances
🔎 Overbought
🔎 And upcoming token unlock events
━━━━━━━━━━━━━━━━
🚀 The bullish scenario
━━━━━━━━━━━━━━━━
If the price manages to break through:
🎯 0.04666$
Then holding above:
🎯 0.04880$
With sustained volume and demand, we may see an attempt to reach:
🔥 0.05000$
🔥 0.05500 – 0.06000$
🔥 0.06300 – 0.06700$ as potential extensions
⚠️ These are potential technical levels, not guaranteed targets.
━━━━━━━━━━━━━━━━
🛡️ The strongest support zones
━━━━━━━━━━━━━━━━
🟢 0.039 – 0.040$
The first zone I watch in case profit-taking starts.
🟢 0.032 – 0.033$
A very important support zone to maintain the strength of the move.
🟢 0.029 – 0.030$
An important structural support from the previous move.
🟢 0.020 – 0.0205$
Deeper support, and losing it may mean the price enters a larger correction.
🟢 0.018 – 0.0187$
The Daily EMA20 zone, and it remains important for the medium-term trend.
━━━━━━━━━━━━━━━━
⚠️ A very important factor: token unlocking
━━━━━━━━━━━━━━━━
📅 September 21, 2026 stands out as an important date for AKE.
According to a report published via Binance News, a large amount of AKE tokens is scheduled to be opened/released on this date, and specialized sources estimate the quantity as:
🔥 2.1 – 2.13 billion AKE
This represents an important event in the circulating supply.
❗ But pay attention:
Token unlocking does not automatically mean the price will drop.
That means an additional amount of tokens becomes available, and thus the probabilities may rise:
📌 Increased liquidity
📌 Higher volatility
📌 The appearance of profit-taking operations
📌 Or an increase in selling pressure if part of the tokens gets sold
Therefore I deal with the period around
📅 September 21
As an area worth watching very closely.
━━━━━━━━━━━━━━━━
📈 RSI provides an important signal
━━━━━━━━━━━━━━━━
RSI(6) ≈ 83.7
RSI(14) ≈ 77.6
RSI(24) ≈ 75.1
🔥 Momentum is very strong.
But at the same time, RSI indicators are at elevated levels, which means the chance of a cooldown or short-term correction should not be ignored.
Here is the difference between:
❌ Chasing the price
and
✅ Wait for a clear level and manage risk.
━━━━━━━━━━━━━━━━
🔄 Scenarios I’m monitoring
━━━━━━━━━━━━━━━━
🟢 Scenario one:
Break 0.04666$ then 0.04880$ and hold above them with strong volume.
➡️ Then the probability of momentum continuing toward 0.050$, and then toward the higher zones, increases.
🟡 Scenario two:
Failed breakout of the top, then correction toward 0.039–0.040$.
➡️ If strong buying appears there, the zone may turn into a bounce point and a new attempt to move upward.
🔴 Scenario three:
A break of 0.032$ with a clear daily close and an increase in selling volume.
➡️ Then 0.029–0.030$ and 0.020$ may fall within the correction zones that should be watched.
━━━━━━━━━━━━━━━━
🧠 Summary
━━━━━━━━━━━━━━━━
AKE is currently showing clear strength on the daily timeframe, but strength does not mean the price will move up in a straight line.
🎯 The most important resistance:
0.04666$ → 0.04880$
🎯 The most important possible targets:
0.050$ → 0.055–0.060$ → 0.063–0.067$
🛡️ The most important supports:
0.040$ → 0.033$ → 0.030$ → 0.020$
⚠️ And the most important upcoming event:
📅 Opening a large amount of AKE on September 21.
Therefore, the coming days may bring high volatility, especially if token unlocking coincides with RSI reaching high overbought levels.
💡 Remember:
The market does not reward those who chase the candle…
Because only someone who knows where to watch, when to wait, and when to admit that the scenario has changed.
⚠️ This is an educational technical analysis, not a guarantee of profit or financial advice.
━━━━━━━━━━━━━━━━
✍️ Analysis by Engineer Ali Al-Shaghmmmi
━━━━━━━━━━━━━━━━
#AKE