
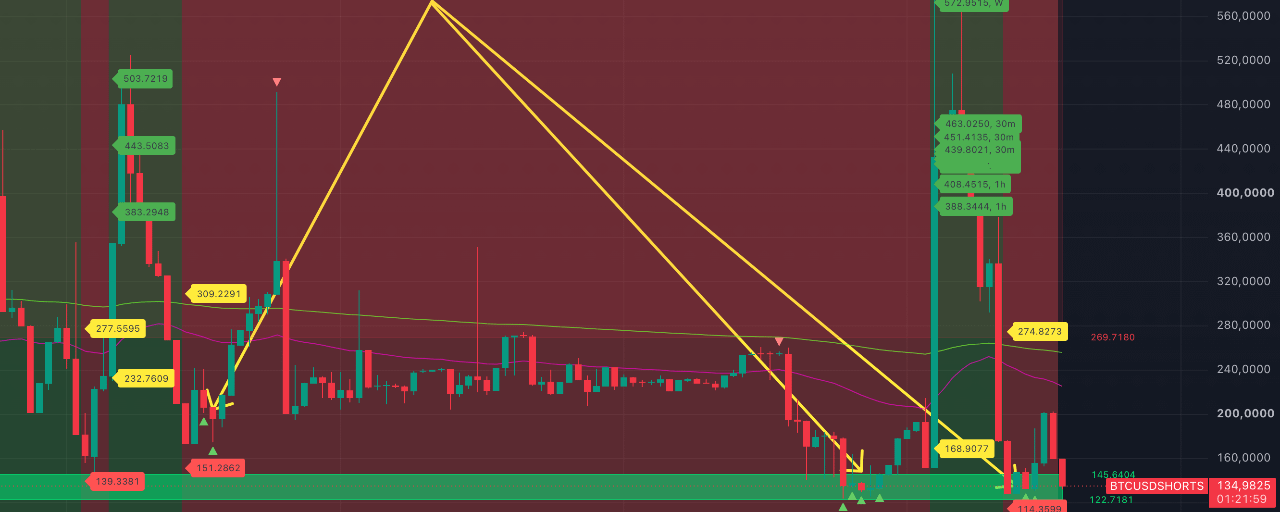


What on the market pump on September 18 does the BTCUSDSHORTS metric show?
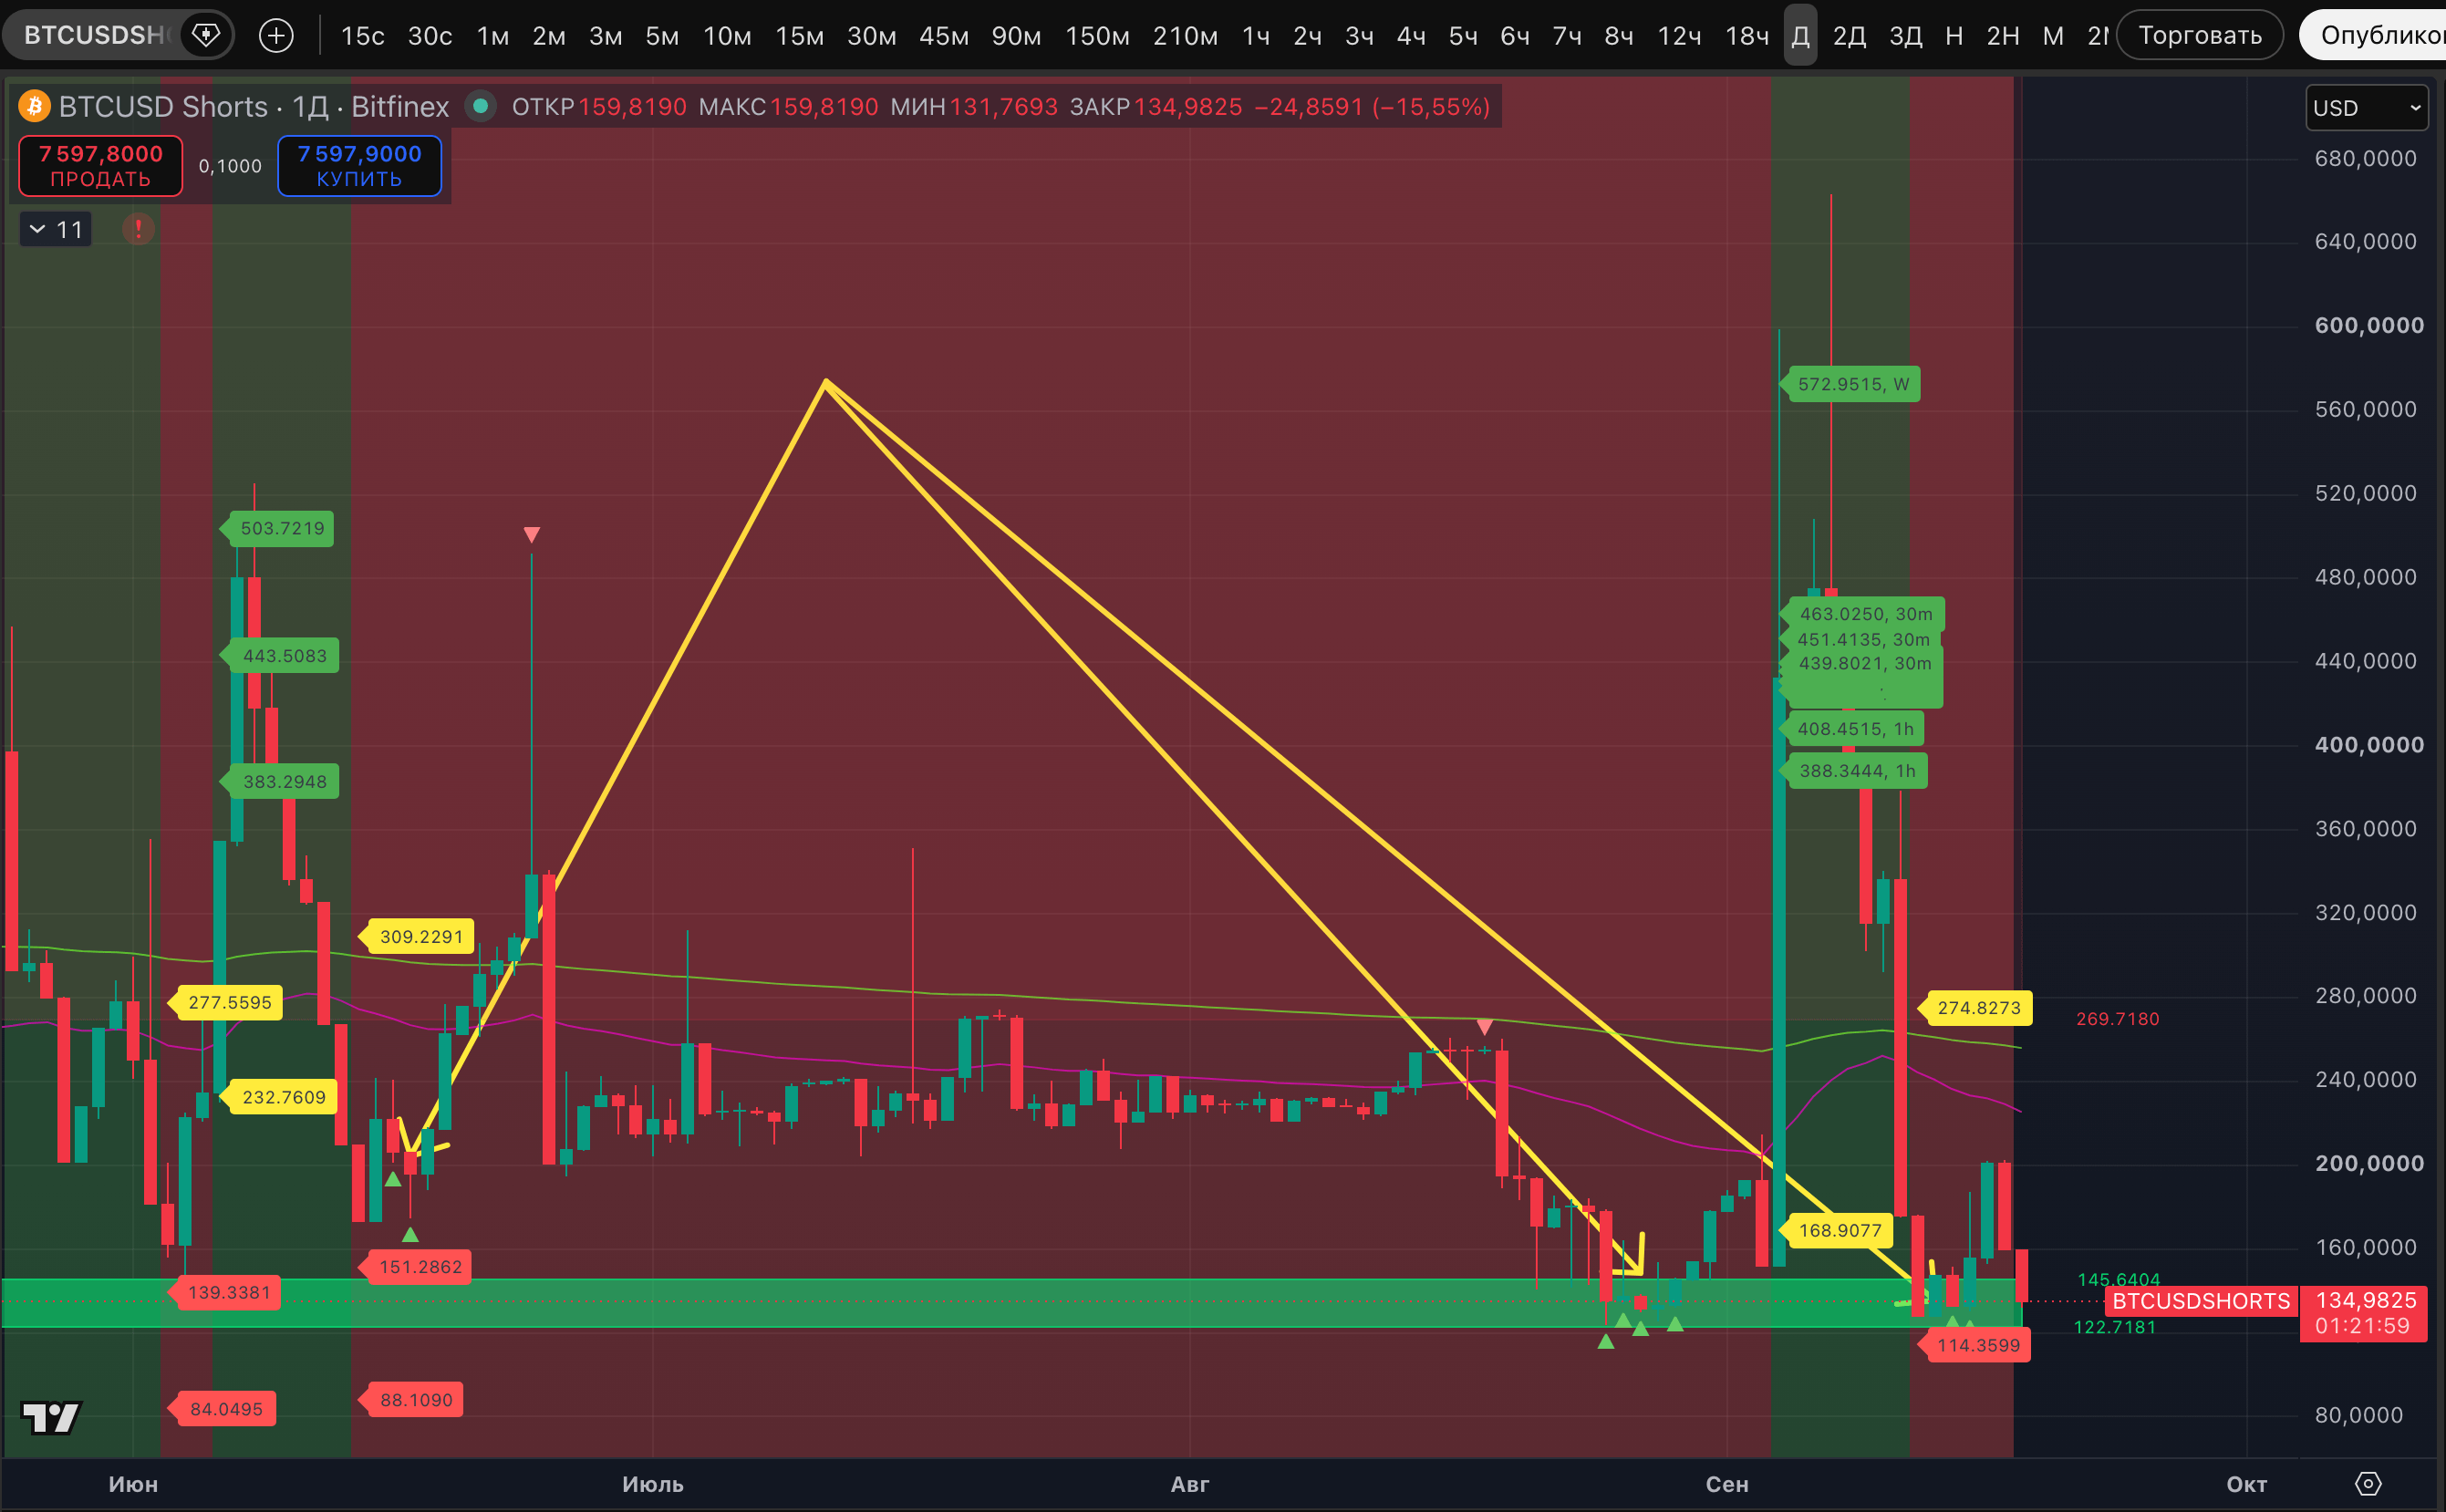
Recall that BTCUSHORTS, like BTCUSDLONGS, are metrics from the Bitfinex crypto exchange, the analysis of which allows conclusions to be drawn about the behavior of "smart money." The first shows the number of shorts on the exchange; the second shows the number of longs. More precisely, not exactly the number. If BTCUSDSHORTS currently shows 135, that means that on Bitfinex there are currently approximately 135 BTC of total open leveraged short positions on BTC/USD.
If we analyze the chart of the number of longs based on stable trends (and there the movement often goes in a sine wave), then the chart of the number of shorts is based on the signals of extremes, the marks of the high and the low.
And exactly taking into account the marks for potential loyalty on the daily TF, we gave a forecast for September 14-16 for a reversal of the metric upward and an increase in the pressure of short positions on the price of Bitcoin. Which started playing out on September 15-16. But on September 17-18, "something went wrong" - the metric began to absorb the growth and has now almost reached the starting levels.
IMPORTANT - the loyalty signals for now are NOT broken. If the metric continues to fall and starts to consolidate below 130 - then we can talk about a break. And right now - no.
Also, let us remind you that last time this metric showed such marks on June 16-17 and August 25-29. After that, every time, as you can see, there followed a reversal of BTCUSD SHORTS, and quite a pronounced one. The price of #BTC showed active growth up to these days, and then it moved into a range or even went into a correction. In the case of June 16-17, these signals became the start of a correction from almost $67,000 down to the low of $57,800 on July 1. Let's see what will happen now. So far, at the very least, it is clear that the bulls did not get an easy third consecutive signal play.