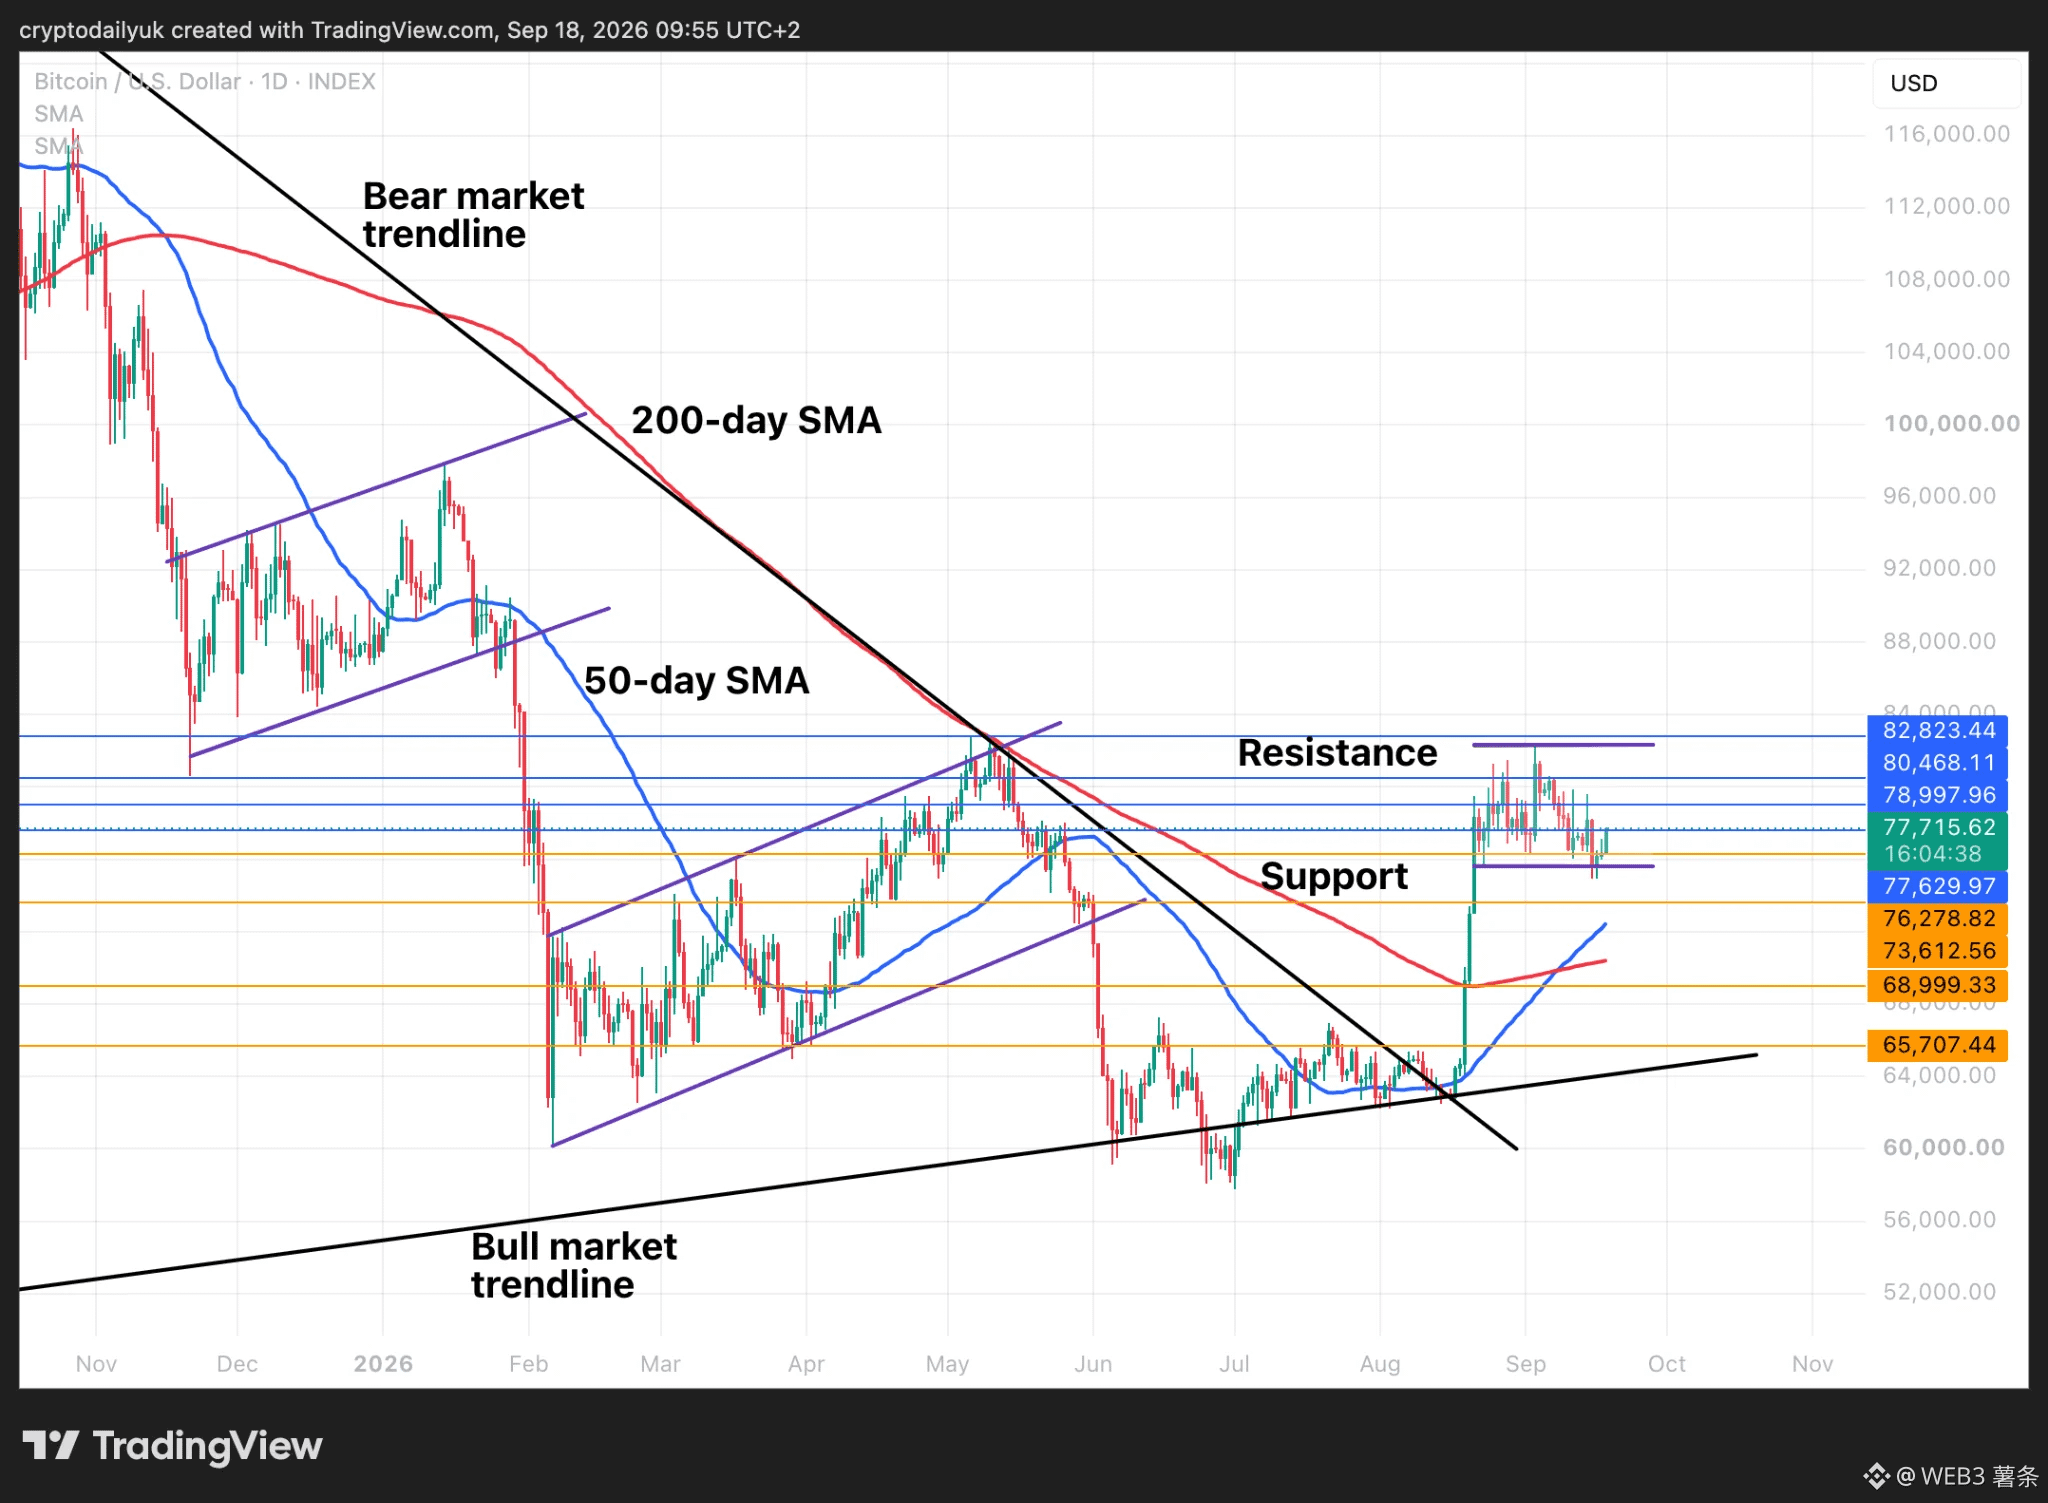
Bitcoin’s daily price trend remains relatively strong. Recently, it not only broke above the descending trendline, but also formed a consolidation pattern similar to a “bull flag.” In simple terms, after a rise in the earlier phase, it has temporarily taken a breather; if it continues upward and breaks higher, it could see a stronger market move.
In addition, the 50-day moving average has crossed above the 200-day moving average, forming the so-called “golden cross,” which is often viewed by the market as a positive technical signal.
Next, focus on the upper boundary of the bull flag and the recent highs. If BTC can break through and hold above them, the market may further extend upward, potentially even challenging the $100,000 level again. However, technical patterns are only for reference—actual price action still depends on the relative strength of buyers and sellers going forward.
In addition, the 50-day moving average has crossed above the 200-day moving average, forming the so-called “golden cross,” which is often viewed by the market as a positive technical signal.
Next, focus on the upper boundary of the bull flag and the recent highs. If BTC can break through and hold above them, the market may further extend upward, potentially even challenging the $100,000 level again. However, technical patterns are only for reference—actual price action still depends on the relative strength of buyers and sellers going forward.