
Mira小白桃
602 Posts

Mira小白桃
推特X:xiaobaitao05,越南胡志明,边学Web3边看市场,每下午准时开播陪你聊行情和热点, 分享学习心得, 陪新手一起成长

BNB Holder
High-Frequency Trader
4.2 Months
257 Following
16.6K+ Followers
2.2K+ Liked
Posts
All
Quotes
Videos
Live
PINNED
PINNED




花涧空
·
--
“The Clear Bill’s failure is extremely detrimental to cryptocurrencies.”
“No, that’s not the case. Have you read this bill?”
“No. Have you?”
“No.”
“No, that’s not the case. Have you read this bill?”
“No. Have you?”
“No.”

Bitroot铄鸿
·
--
空山栖寂,不纳纷喧,清风自来,漫渡岁岁安然!
Empty mountains dwell in peace, no chaotic noise to bear; pure wind comes of itself, blessing every peaceful year!
Empty mountains dwell in peace, no chaotic noise to bear; pure wind comes of itself, blessing every peaceful year!


CJ_GraceWang1688
·
--
🎁🎁🎁
$BTC
#比特币突破77000美元
Did you go long?
$BTC
#比特币突破77000美元
Did you go long?

⁰MR RAJ⁰
·
--
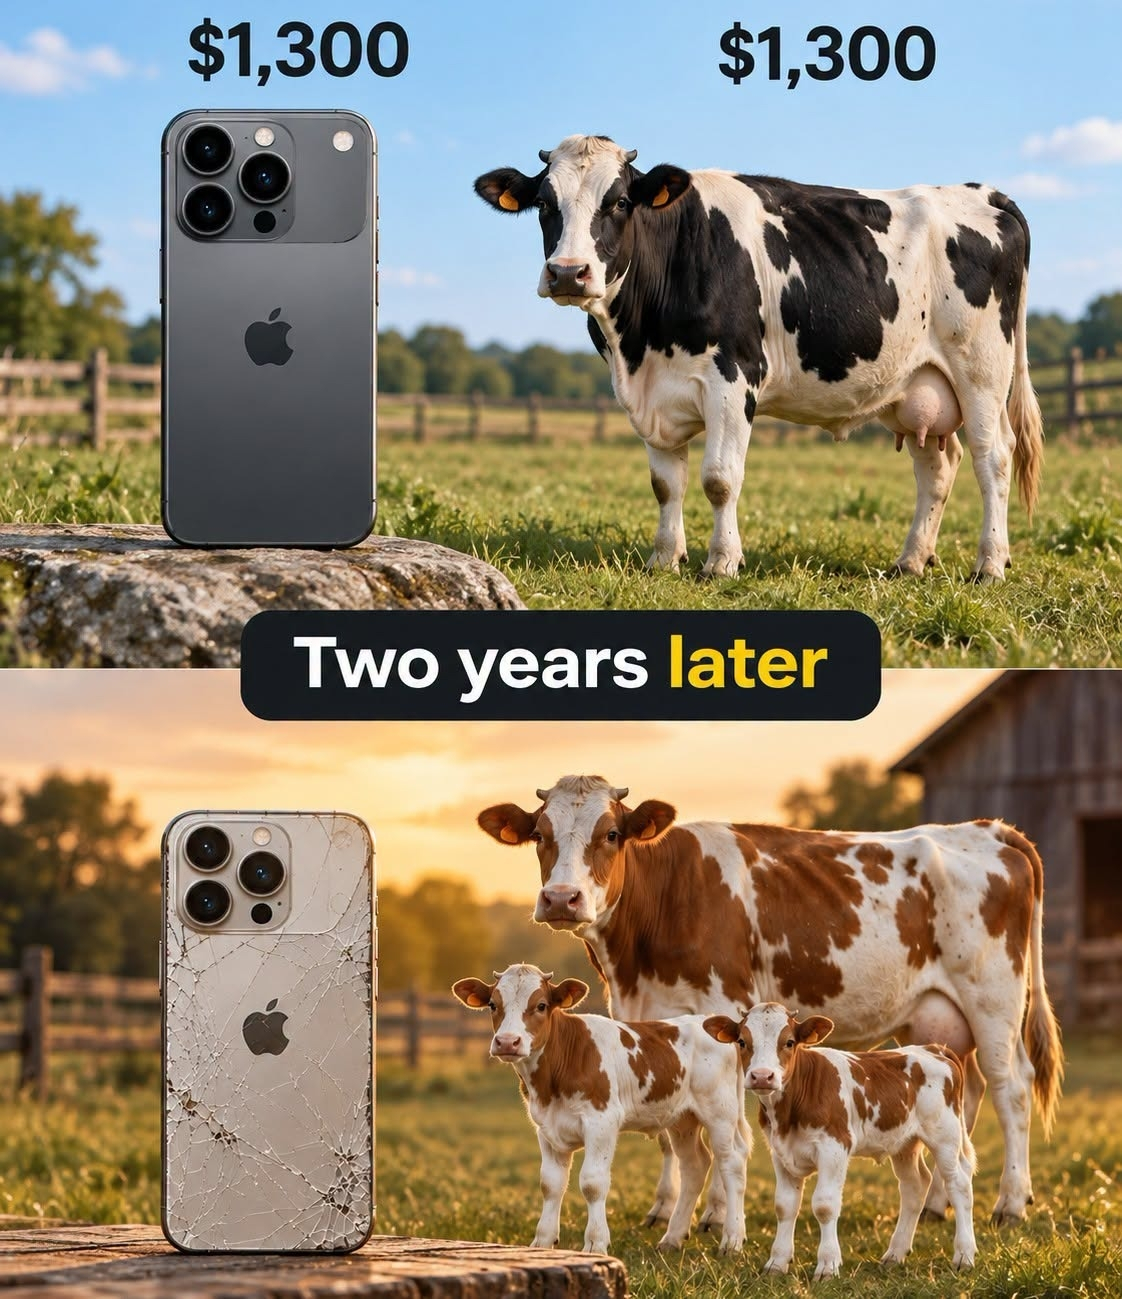
BullishSame price. Completely different investment. 😂
$ONE $AVA $EDEN
#FedRateWatch #CPIWatch #DotPlotSignalsOneMoreHikeIn2026 #FedSEPProjects2026RateAt4.1% #RobinhoodToSupportCircleArcNetwork
$ONE $AVA $EDEN
#FedRateWatch #CPIWatch #DotPlotSignalsOneMoreHikeIn2026 #FedSEPProjects2026RateAt4.1% #RobinhoodToSupportCircleArcNetwork
美国大总统
·
--
September 14: AI megacorporations will not slow down development, and AI stocks will not collapse because of it!
Serenity said that leading AI labs such as OpenAI and Anthropic are almost certainly unable—or unwilling—to intentionally slow down development. Moreover, most of the “regulations” they are trying to put in place are largely regulatory capture intended to slow down competition. The public statements about “slowing development” are mostly performative.
🧧🧧🧧🧧🧧🧧🧧🧧🧧🧧🧧🧧🧧🧧
Serenity also criticized claims on the X platform that AI-related stocks (such as NVDA and TSM) are “about to collapse,” emphasizing that memory and the chip supply chain will remain tight through 2031. This shows that the contest for AI development resources is still accelerating.
Serenity said that leading AI labs such as OpenAI and Anthropic are almost certainly unable—or unwilling—to intentionally slow down development. Moreover, most of the “regulations” they are trying to put in place are largely regulatory capture intended to slow down competition. The public statements about “slowing development” are mostly performative.
🧧🧧🧧🧧🧧🧧🧧🧧🧧🧧🧧🧧🧧🧧
Serenity also criticized claims on the X platform that AI-related stocks (such as NVDA and TSM) are “about to collapse,” emphasizing that memory and the chip supply chain will remain tight through 2031. This shows that the contest for AI development resources is still accelerating.



九千金-融易挣乾
·
--
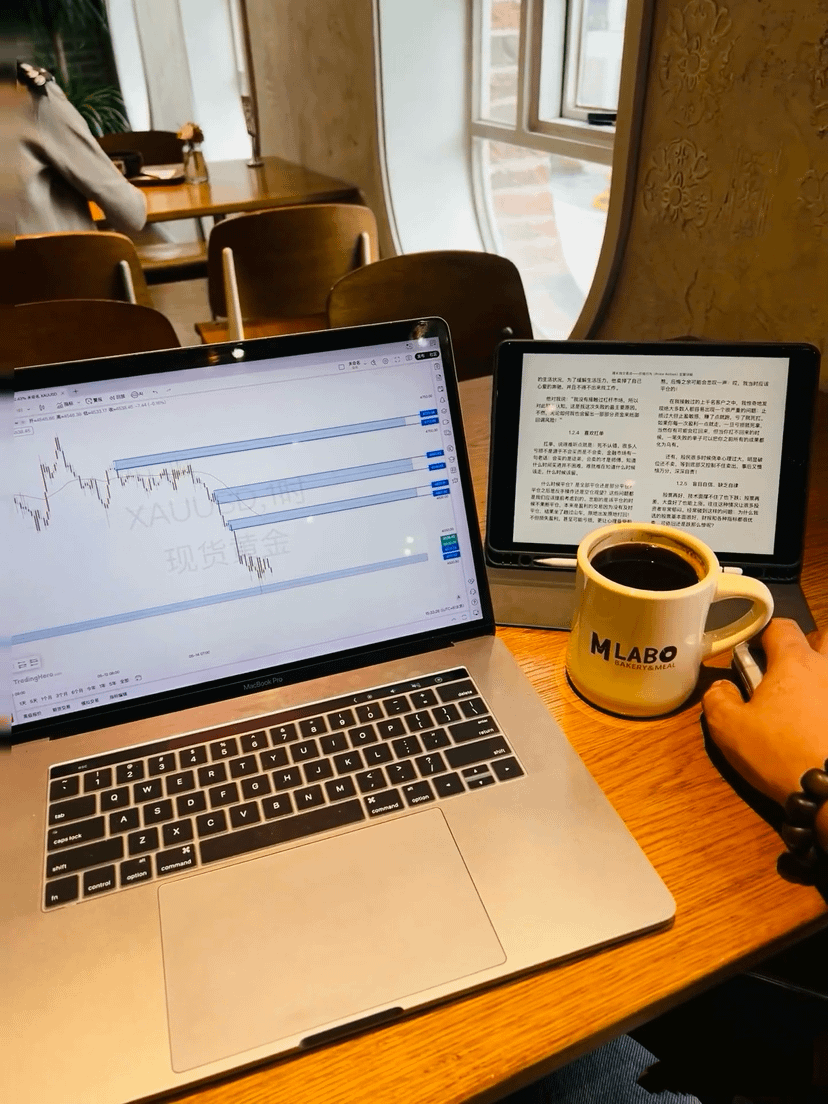
Half the happiness is carbs, half is the focus on making money
Refill coffee, keep trading, and live the days with flavor 📊
Refill coffee, keep trading, and live the days with flavor 📊


周周1688
·
--
🇨🇳 Today|September 17 Crypto Market Brief
🔥 FOMC delivered results, and the market shifted from “waiting for answers” to “digesting the answers”
The Federal Reserve raised rates for the first time in three years by 25 basis points, bringing the federal funds rate to 3.75%–4.00%.
BTC briefly fell to around $75.3K, then regained and moved back above $76K.
📉 ETFs: about $746M outflow over two days
On September 15, spot BTC ETF net outflows were about $450M; on September 16, there was another outflow of about $296M.
Together, the two-day total is nearly $746M—one of the largest consecutive outflow streaks recently.
But this looks more like a concentrated reaction to blocked CLARITY momentum and the FOMC outcome, not simply a sign of long-term capital leaving.
🏛 US Regulation: the Senate and House head in different directions
The CLARITY Act did not receive the 60 votes needed to advance in the Senate.
Meanwhile, two related bills passed in the House committee:
American Reserve Modernization Act: 28–21
Digital Asset Tax Certainty Act: 38–5
Market-structure legislation is temporarily stalled, but BTC reserves and the digital asset tax framework are still moving forward.
⚡ Circle Arc Mainnet officially goes live
Circle launched an L1 Arc that uses USDC as gas, targeting sub-second finality.
Institutions including BlackRock, Visa, Mastercard, DTCC, and ICE participate in validating nodes, while 100+ apps and institutional projects enter the ecosystem in parallel.
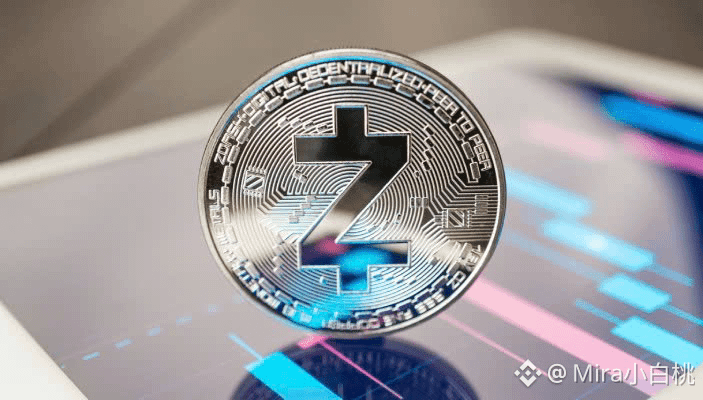
🟢 ZEC becomes today’s standout mover
Zcash rose as much as about 18%–23%.
The NU7 upgrade will reduce target block time from 75 seconds to 25 seconds while keeping the existing halving mechanism.
📊 Market Snapshot
BTC ≈ $76.4K
ETH ≈ $2.44K
SOL ≈ $100
BNB ≈ $710+
XRP ≈ $1.29
🎯 Today’s key is not “whether rates will be raised,” but “what happens after the hike.”
The 25bp increase is already in the books.
Now the market is really watching the Dot Plot, the inflation path, and whether the remaining time through 2026 will still see tightening.
BTC is still looking for direction within the $75K–$80K range.
#1688家族family #蓝朋友1688 #CryptoWatchMay2024 #EthereumEFT #FOMC
🔥 FOMC delivered results, and the market shifted from “waiting for answers” to “digesting the answers”
The Federal Reserve raised rates for the first time in three years by 25 basis points, bringing the federal funds rate to 3.75%–4.00%.
BTC briefly fell to around $75.3K, then regained and moved back above $76K.
📉 ETFs: about $746M outflow over two days
On September 15, spot BTC ETF net outflows were about $450M; on September 16, there was another outflow of about $296M.
Together, the two-day total is nearly $746M—one of the largest consecutive outflow streaks recently.
But this looks more like a concentrated reaction to blocked CLARITY momentum and the FOMC outcome, not simply a sign of long-term capital leaving.
🏛 US Regulation: the Senate and House head in different directions
The CLARITY Act did not receive the 60 votes needed to advance in the Senate.
Meanwhile, two related bills passed in the House committee:
American Reserve Modernization Act: 28–21
Digital Asset Tax Certainty Act: 38–5
Market-structure legislation is temporarily stalled, but BTC reserves and the digital asset tax framework are still moving forward.
⚡ Circle Arc Mainnet officially goes live
Circle launched an L1 Arc that uses USDC as gas, targeting sub-second finality.
Institutions including BlackRock, Visa, Mastercard, DTCC, and ICE participate in validating nodes, while 100+ apps and institutional projects enter the ecosystem in parallel.
🟢 ZEC becomes today’s standout mover
Zcash rose as much as about 18%–23%.
The NU7 upgrade will reduce target block time from 75 seconds to 25 seconds while keeping the existing halving mechanism.
📊 Market Snapshot
BTC ≈ $76.4K
ETH ≈ $2.44K
SOL ≈ $100
BNB ≈ $710+
XRP ≈ $1.29
🎯 Today’s key is not “whether rates will be raised,” but “what happens after the hike.”
The 25bp increase is already in the books.
Now the market is really watching the Dot Plot, the inflation path, and whether the remaining time through 2026 will still see tightening.
BTC is still looking for direction within the $75K–$80K range.
#1688家族family #蓝朋友1688 #CryptoWatchMay2024 #EthereumEFT #FOMC


橙子Joyce
·
--
BullishWill the Federal Reserve raise rates as expected this week? Wall Street is debating: will it end the U.S. stock bull market?
After an unexpectedly strong U.S. CPI report came out last Friday, traders generally expect the Federal Reserve to begin raising rates at this week’s policy meeting—marking the first rate hike in more than three years.
Historically, previous rounds of rate hikes have offered a reference point for today’s market. Based on past experience (though history of course can’t guarantee the future), U.S. stocks may first weaken, then rebound.
Among the six tightening cycles since 1994, during the first four months after the rate-hike cycle began, the S&P 500’s average return was negative.
This suggests that once the “rate-hike shoe” drops, U.S. stocks may look lackluster through the beginning of next year.
As of the close last Friday, the benchmark U.S. equity index, the S&P 500, is up nearly 12% year to date. Strong corporate earnings and a fairly resilient economy have provided solid support for bulls in the stock market.
If you extend the time horizon, the S&P 500’s performance tends to improve gradually: in the 12 months after the start of a rate-hiking cycle, the index’s average return is close to 7%, with a median return of about 11%. (Using median-based statistics helps remove distortions from extreme outliers—for example, the index surged more than 40% after hikes began in March 1997.)
If the Federal Reserve implements a rate hike this Wednesday, it will be the first hike since July 2023—when the Fed raised rates to a range of 5.25% to 5.50%.
Currently, the federal funds rate in the U.S. is at 3.50% to 3.75%. According to the CME Group’s FedWatch tool, futures traders currently assign an 86% probability to a 25-basis-point hike this week.
One positive factor for the market is that mega-scale cloud service providers are still driving growth in excess returns through large-scale AI spending. The S&P 500 component stocks’ forecast for earnings growth in 2027 is expected to reach double digits. If the outlook for AI spending remains unchanged, it may be enough to offset any cooling in optimistic sentiment caused by the rate hikes.
Another bright spot for equities is that although inflation remains sticky, it appears to be slowing. The inflation rate has fallen from a May peak of 4.2%. This should allow the Federal Reserve to take a more gradual approach, and the data shows that the pace of rate hikes is crucial for stock performance—slower pacing gives investors more time to absorb policy changes!
$BZ
$CL
Energy
After an unexpectedly strong U.S. CPI report came out last Friday, traders generally expect the Federal Reserve to begin raising rates at this week’s policy meeting—marking the first rate hike in more than three years.
Historically, previous rounds of rate hikes have offered a reference point for today’s market. Based on past experience (though history of course can’t guarantee the future), U.S. stocks may first weaken, then rebound.
Among the six tightening cycles since 1994, during the first four months after the rate-hike cycle began, the S&P 500’s average return was negative.
This suggests that once the “rate-hike shoe” drops, U.S. stocks may look lackluster through the beginning of next year.
As of the close last Friday, the benchmark U.S. equity index, the S&P 500, is up nearly 12% year to date. Strong corporate earnings and a fairly resilient economy have provided solid support for bulls in the stock market.
If you extend the time horizon, the S&P 500’s performance tends to improve gradually: in the 12 months after the start of a rate-hiking cycle, the index’s average return is close to 7%, with a median return of about 11%. (Using median-based statistics helps remove distortions from extreme outliers—for example, the index surged more than 40% after hikes began in March 1997.)
If the Federal Reserve implements a rate hike this Wednesday, it will be the first hike since July 2023—when the Fed raised rates to a range of 5.25% to 5.50%.
Currently, the federal funds rate in the U.S. is at 3.50% to 3.75%. According to the CME Group’s FedWatch tool, futures traders currently assign an 86% probability to a 25-basis-point hike this week.
One positive factor for the market is that mega-scale cloud service providers are still driving growth in excess returns through large-scale AI spending. The S&P 500 component stocks’ forecast for earnings growth in 2027 is expected to reach double digits. If the outlook for AI spending remains unchanged, it may be enough to offset any cooling in optimistic sentiment caused by the rate hikes.
Another bright spot for equities is that although inflation remains sticky, it appears to be slowing. The inflation rate has fallen from a May peak of 4.2%. This should allow the Federal Reserve to take a more gradual approach, and the data shows that the pace of rate hikes is crucial for stock performance—slower pacing gives investors more time to absorb policy changes!
$BZ
$CL
Energy

圣克斯Lucky1688
·
--
🧧🎁🧧🎁🧧🎁
Around September 18, a series of important infrastructure upgrades, project pivots, and industry ecosystem developments took place in the blockchain sector:
1. The Vanar chain completed a major migration and formally shut down its independent L1 mainnet Vanar project. On September 18, it officially initiated the shutdown and liquidation procedures for its original independent Layer 1 blockchain. Before that, on September 17, the project had completed the migration of its token contracts, and trading of VANRY tokens on Ethereum and Polygon was formally paused, fully transitioning to the Base chain. This move marks its departure from the early era of independent public chains. In the future, its strategy will fully shift toward an AI application ecosystem built on the Base chain and “AI Organizations” (AI orgs) platform (such as the Foundry platform planned for release on October 1).
2. In mid-September, the industry’s pragmatic shift toward real-world Web3 business adoption accelerated. The focus of discussions in the Web3 space is moving faster from pure token speculation and concept hype toward “eliminating real-world friction in commerce.” Developers and startups are increasingly inclined to apply blockchain technology to scenarios that truly require multi-party trust, tamper-proof credentials, supply-chain anti-counterfeiting, and digital identity verification—while keeping sensitive data and core business logic off-chain. The emphasis is on “trust infrastructure is better than token theater.”
3. Global regional Web3 and blockchain conferences continued to advance. With mid-September approaching, Web3 technical events and conferences combining academia and industry (such as regional tech events like Brazil’s Web3 PE, etc.) are also rolling out in close succession. These discussions mainly focus on concrete deployment cases of blockchain in areas such as the digital economy, compliant payments, and the creative industries. Overall, as of September 18, the Web3 industry is undergoing structural adjustments: public-chain ecosystems are converging toward mainstream high-performance networks (such as Base) through architectural upgrades, while the industry’s application layer is becoming more pragmatic and compliant.
Follow me and get the $SOL red envelope in Answer 1!
🧧🎁🧧🎁🧧🎁
Around September 18, a series of important infrastructure upgrades, project pivots, and industry ecosystem developments took place in the blockchain sector:
1. The Vanar chain completed a major migration and formally shut down its independent L1 mainnet Vanar project. On September 18, it officially initiated the shutdown and liquidation procedures for its original independent Layer 1 blockchain. Before that, on September 17, the project had completed the migration of its token contracts, and trading of VANRY tokens on Ethereum and Polygon was formally paused, fully transitioning to the Base chain. This move marks its departure from the early era of independent public chains. In the future, its strategy will fully shift toward an AI application ecosystem built on the Base chain and “AI Organizations” (AI orgs) platform (such as the Foundry platform planned for release on October 1).
2. In mid-September, the industry’s pragmatic shift toward real-world Web3 business adoption accelerated. The focus of discussions in the Web3 space is moving faster from pure token speculation and concept hype toward “eliminating real-world friction in commerce.” Developers and startups are increasingly inclined to apply blockchain technology to scenarios that truly require multi-party trust, tamper-proof credentials, supply-chain anti-counterfeiting, and digital identity verification—while keeping sensitive data and core business logic off-chain. The emphasis is on “trust infrastructure is better than token theater.”
3. Global regional Web3 and blockchain conferences continued to advance. With mid-September approaching, Web3 technical events and conferences combining academia and industry (such as regional tech events like Brazil’s Web3 PE, etc.) are also rolling out in close succession. These discussions mainly focus on concrete deployment cases of blockchain in areas such as the digital economy, compliant payments, and the creative industries. Overall, as of September 18, the Web3 industry is undergoing structural adjustments: public-chain ecosystems are converging toward mainstream high-performance networks (such as Base) through architectural upgrades, while the industry’s application layer is becoming more pragmatic and compliant.
Follow me and get the $SOL red envelope in Answer 1!
🧧🎁🧧🎁🧧🎁



Hawk自由哥
·
--
🦅#Hawk Eagle Coin🧧🧧🧧
✅2 missions:
🔵 Maintain ecosystem balance🍃
🔵 Spread the spirit of freedom🎉
✅2 goals:
🟡️ Surpass SHIB’s market cap💪
🟡️ 100 million people worldwide hold it🔥
✅1 commitment: If we haven’t surpassed SHIB’s market cap, we won’t sell a single Hawk 👉 Vision: to influence humanity with free-value beliefs💖
Please make sure to confirm the BSC contract tail number: 0d2d
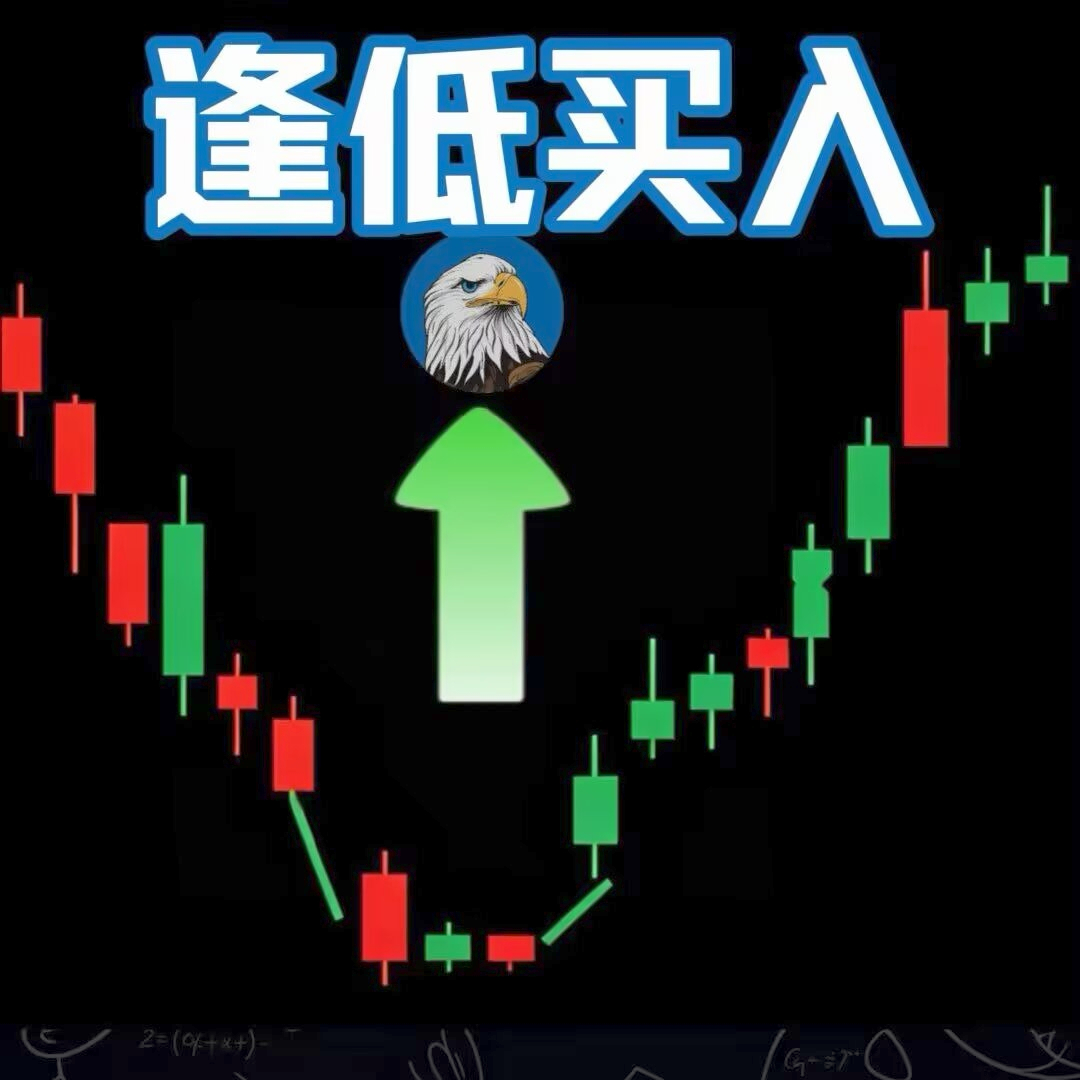
After more than two years of community-driven time and accumulation; through natural washout, the current price is now in the building-a-base stage. This is the best time to accumulate and add positions—seize the opportunity🌈 and begin your own crypto legend journey🎉🎉🎉
✅2 missions:
🔵 Maintain ecosystem balance🍃
🔵 Spread the spirit of freedom🎉
✅2 goals:
🟡️ Surpass SHIB’s market cap💪
🟡️ 100 million people worldwide hold it🔥
✅1 commitment: If we haven’t surpassed SHIB’s market cap, we won’t sell a single Hawk 👉 Vision: to influence humanity with free-value beliefs💖
Please make sure to confirm the BSC contract tail number: 0d2d
After more than two years of community-driven time and accumulation; through natural washout, the current price is now in the building-a-base stage. This is the best time to accumulate and add positions—seize the opportunity🌈 and begin your own crypto legend journey🎉🎉🎉



520龙行天下
·
--
Today’s Crypto Market Hot Topics: The Fed rate-hike “shoe” has dropped, market sentiment has warmed up, and crypto prices are surging. The DeFi sector has jumped 6.8%; UNI is up nearly 20% and has broken above $8; ZEC has hit a new high again; NEAR and HYPE lead the gains. The SEC has rolled out a novel exemption for tokenized stocks, and the RWA concept is heating up. BTC is holding steady around $76,000. Invest rationally and watch out for risks.


正乾商学--四条2
·
--
Are you really suited to make a living by trading?
Part Six
⑥ Finally, ask yourself one more question
Do you really spend a lot of time every day learning and analyzing?
Many people ask me:
“Why don’t I have results even after trading for a year?”
But if you dig in carefully:
How many hours do you actually spend learning every day?
Do you do a review afterward?
Do you keep a trading log?
Do you track your win rate, profit-to-loss ratio, and maximum drawdown?
Do you analyze what kinds of market conditions you are most likely to make mistakes in?
In the end, you’ll find that:
In fact, many people don’t really do it.
So some people say:
“I’m not good at trading, so trading isn’t for me.”
I think that conclusion was reached too quickly.
You should first ask yourself:
Have I really built a trading environment that suits me?
Have I really found a trading approach that fits my personality?
Have I really put in enough time to learn?
Have I systematically verified my method?
If these questions still haven’t been resolved,
then it’s time to say:
“Trading isn’t working.”
Actually, it’s still too early.
Finally, what I want to say is:
Many people understand “successful trading” as:
Finding a magical indicator.
But in reality, truly long-term, stable trading is more like a complete system:
your income structure
+your lifestyle
+your trading
+your personality
+a trading style that suits you
+knowledge
+risk management
+mental resilience
As long as any one of these elements has been a problem for a long time,
it may eventually show up in your trading results.
So before asking:
“Can I get rich by trading?”
first ask yourself:
“Is my current life really already prepared for me to become a trader?”
This may be far more important than learning another indicator.
If you’re interested in trading, feel free to leave a comment in the comment section or join the chat room to exchange ideas and learn together and grow together!
#Paradigm披露持有ZEC #Paradigm披露持有ZEC
Part Six
⑥ Finally, ask yourself one more question
Do you really spend a lot of time every day learning and analyzing?
Many people ask me:
“Why don’t I have results even after trading for a year?”
But if you dig in carefully:
How many hours do you actually spend learning every day?
Do you do a review afterward?
Do you keep a trading log?
Do you track your win rate, profit-to-loss ratio, and maximum drawdown?
Do you analyze what kinds of market conditions you are most likely to make mistakes in?
In the end, you’ll find that:
In fact, many people don’t really do it.
So some people say:
“I’m not good at trading, so trading isn’t for me.”
I think that conclusion was reached too quickly.
You should first ask yourself:
Have I really built a trading environment that suits me?
Have I really found a trading approach that fits my personality?
Have I really put in enough time to learn?
Have I systematically verified my method?
If these questions still haven’t been resolved,
then it’s time to say:
“Trading isn’t working.”
Actually, it’s still too early.
Finally, what I want to say is:
Many people understand “successful trading” as:
Finding a magical indicator.
But in reality, truly long-term, stable trading is more like a complete system:
your income structure
+your lifestyle
+your trading
+your personality
+a trading style that suits you
+knowledge
+risk management
+mental resilience
As long as any one of these elements has been a problem for a long time,
it may eventually show up in your trading results.
So before asking:
“Can I get rich by trading?”
first ask yourself:
“Is my current life really already prepared for me to become a trader?”
This may be far more important than learning another indicator.
If you’re interested in trading, feel free to leave a comment in the comment section or join the chat room to exchange ideas and learn together and grow together!
#Paradigm披露持有ZEC #Paradigm披露持有ZEC

路飞社区糖宝Luffy
·
--
Less anxiety, more happiness, focus on making money—$SOL . A good mindset, no worries, good luck and wealth run with you. Every day at 13.30, Tangbao’s live stream room is waiting for you.


捷豹1988
·
--
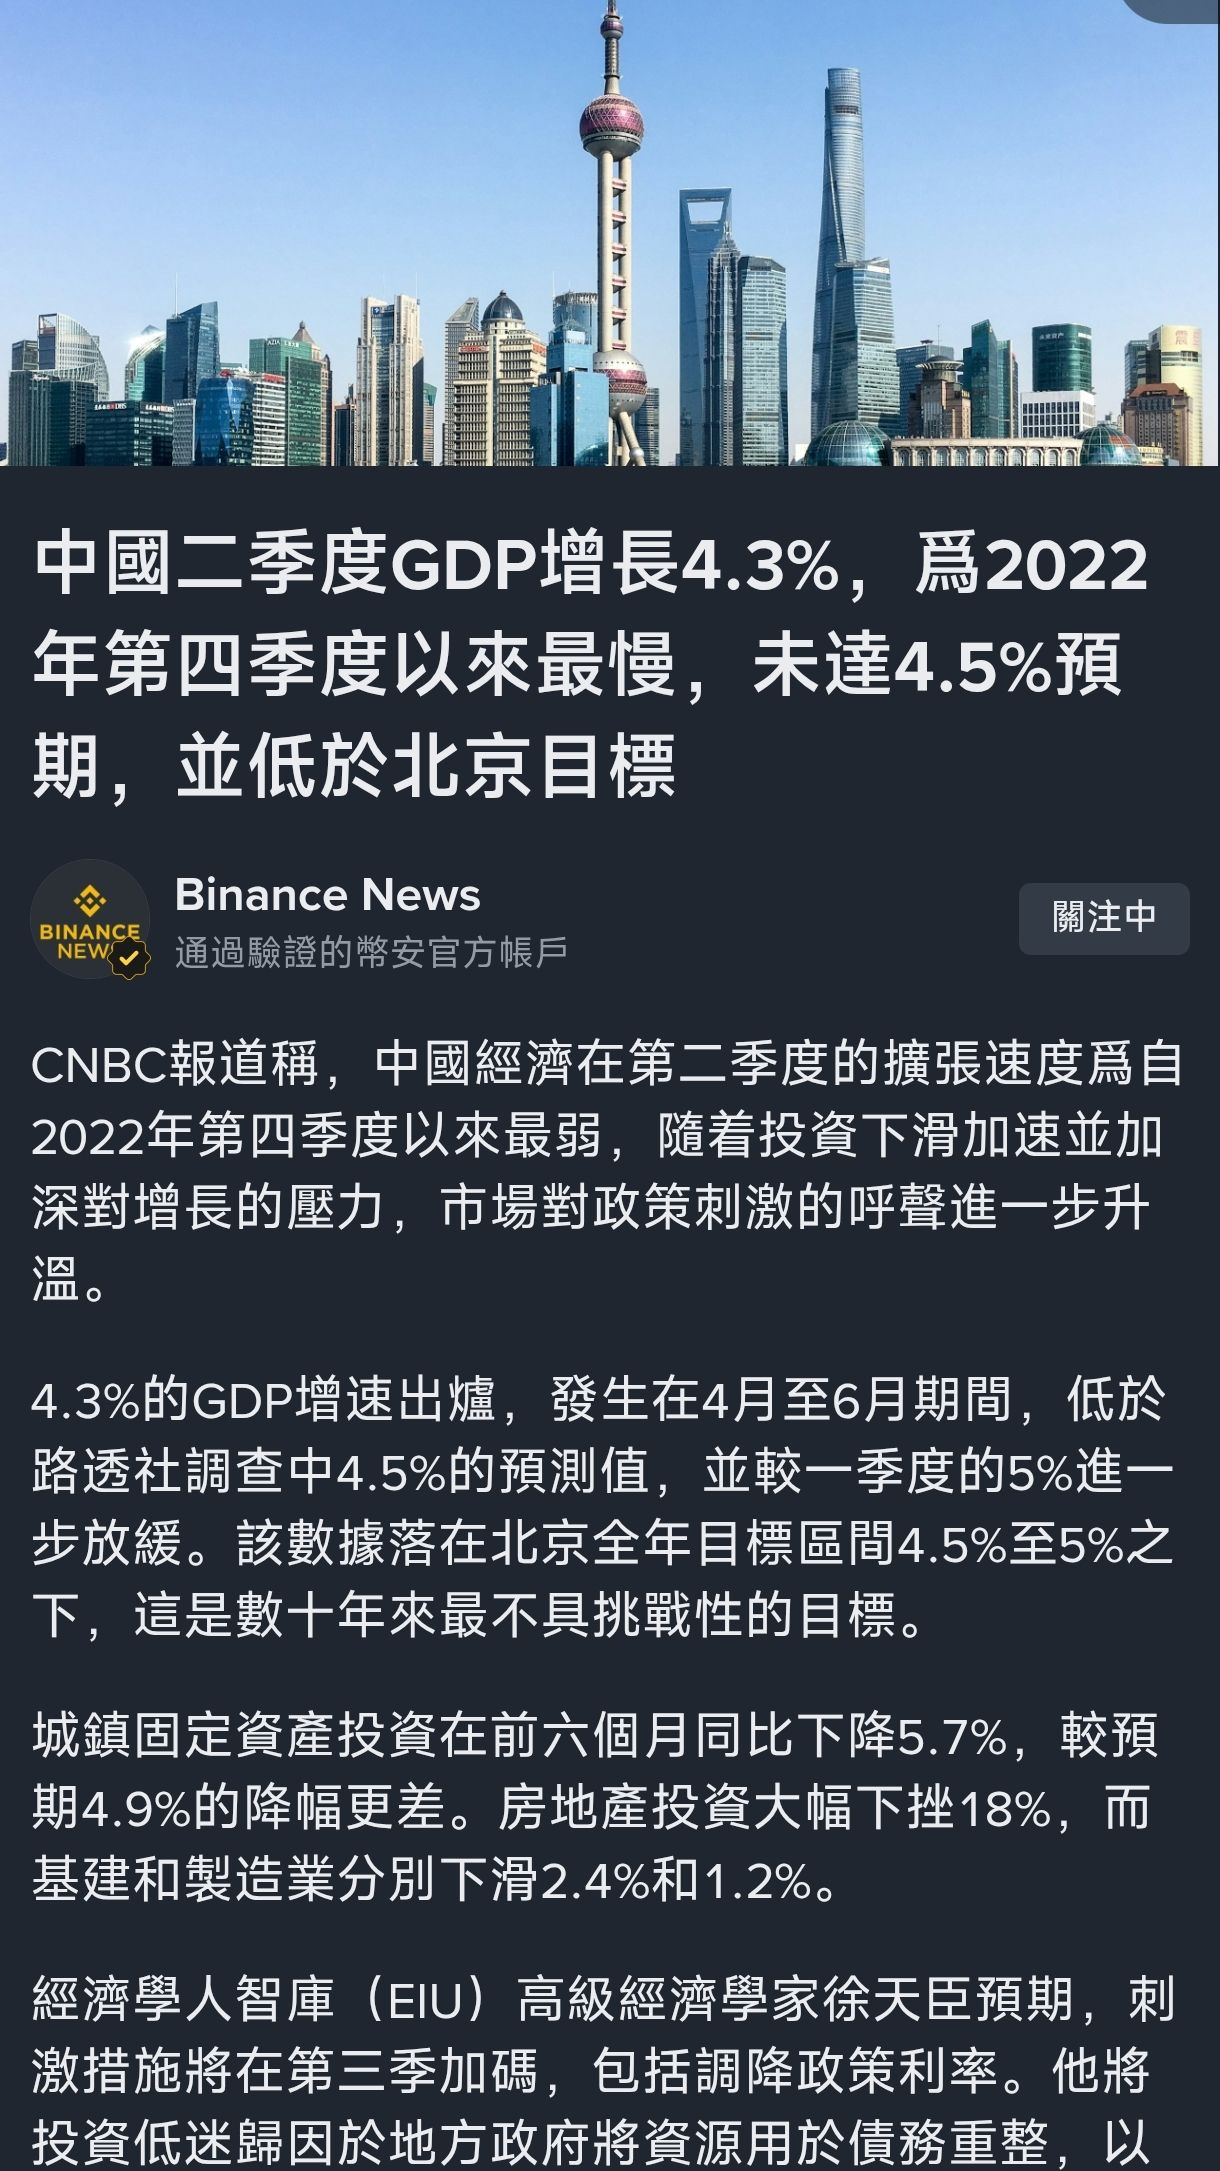
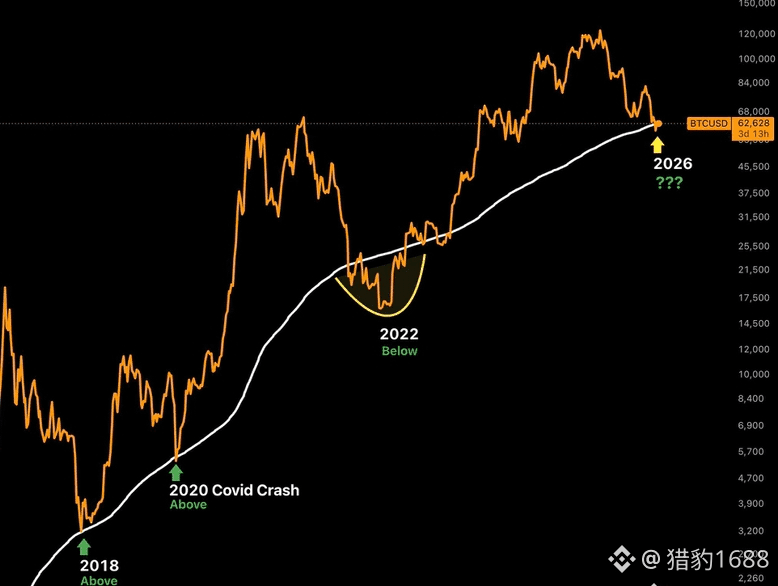
Strong expectations and the tug-of-war with capital flows
How much longer until the bottom?
Are we anticipating it ahead of the third-quarter end?
Or mid-November elections?
A battle between strong policies and weak reality
How far away is “forever”?
Just follow us
Calm down and carry on🤝👊
How much longer until the bottom?
Are we anticipating it ahead of the third-quarter end?
Or mid-November elections?
A battle between strong policies and weak reality
How far away is “forever”?
Just follow us
Calm down and carry on🤝👊

白鲨观点
·
--
BearishIt’s Friday. Let’s break down the key data from this week in the crypto market. After you finish reading, you’ll have a pretty good sense of where things stand:
📊 Price Data
BTC this week: high 79,800, low 74,944, range 6.2%. Currently around 77,000. Weekly: nearly flat.
ETH this week: high 2,640, low 2,360, range 11.9%. Currently around 2,460. Weekly: slightly up.
BTC dominance fell from 59.3% to 58.6%. Funds started rotating toward altcoins and derivatives: trading volume down 13.8%, suggesting short-term capital is waiting on the sidelines—nobody’s making reckless moves.
🔥 Sector Performance (24h)
DeFi +6.8% (top performer): UNI +17%, NEAR +24%, AAVE +8%
DePIN +5.5%: Geodnet +45%
L2 +4.5%
RWA +5%
Meanwhile, major coins rose the least: BTC +0.7%, ETH +1.5%
📰 Weekly Highlights
Monday: The “Clear Act” Senate vote failed 50:49; probability of passage within the year is only 16%
Wednesday: The Fed raised rates by 25 bps to 3.75%–4%; passed unanimously; the dot plot suggests another hike is likely still this year
Thursday: BTC ETF saw a daily outflow of $450 million, the largest since June
Thursday night: The SEC issued an “innovation exemption,” allowing tokenized stocks to trade on-chain (with trading limits and transparency requirements)
Friday early morning: S&P Global announced the acquisition of smart contract security firm OpenZeppelin
💡 My Take:
It looks like there were plenty of negative catalysts this week—failed legislation, rate hikes, ETF outflows—but prices didn’t drop much at all. In fact, altcoins started rising. What does that mean? It suggests the damage from the negatives is weakening, and buy-side demand is stepping in from below.
Especially worth noting are the last two pieces of news: the SEC allowing tokenized stocks to trade on-chain, and S&P Global acquiring OpenZeppelin. Many people focus only on the “Clear Act” failing and assume regulation is basically over—but regulation isn’t simply black or white. Major legislation may not move, but innovation in smaller areas keeps progressing. Traditional finance is also quietly moving into blockchain.
So don’t be too pessimistic, and don’t be too optimistic either. What you’re seeing now is a choppy “bottoming-out” range market: pressure overhead, support below. In terms of strategy, don’t chase or panic-sell—buy low and sell high.
At 4 p.m., let’s chat in the room: “How will next week likely go, and which sectors could have opportunities?” If you’re interested, come join.
$BTC $ETH #BinanceSquare #行情复盘
📊 Price Data
BTC this week: high 79,800, low 74,944, range 6.2%. Currently around 77,000. Weekly: nearly flat.
ETH this week: high 2,640, low 2,360, range 11.9%. Currently around 2,460. Weekly: slightly up.
BTC dominance fell from 59.3% to 58.6%. Funds started rotating toward altcoins and derivatives: trading volume down 13.8%, suggesting short-term capital is waiting on the sidelines—nobody’s making reckless moves.
🔥 Sector Performance (24h)
DeFi +6.8% (top performer): UNI +17%, NEAR +24%, AAVE +8%
DePIN +5.5%: Geodnet +45%
L2 +4.5%
RWA +5%
Meanwhile, major coins rose the least: BTC +0.7%, ETH +1.5%
📰 Weekly Highlights
Monday: The “Clear Act” Senate vote failed 50:49; probability of passage within the year is only 16%
Wednesday: The Fed raised rates by 25 bps to 3.75%–4%; passed unanimously; the dot plot suggests another hike is likely still this year
Thursday: BTC ETF saw a daily outflow of $450 million, the largest since June
Thursday night: The SEC issued an “innovation exemption,” allowing tokenized stocks to trade on-chain (with trading limits and transparency requirements)
Friday early morning: S&P Global announced the acquisition of smart contract security firm OpenZeppelin
💡 My Take:
It looks like there were plenty of negative catalysts this week—failed legislation, rate hikes, ETF outflows—but prices didn’t drop much at all. In fact, altcoins started rising. What does that mean? It suggests the damage from the negatives is weakening, and buy-side demand is stepping in from below.
Especially worth noting are the last two pieces of news: the SEC allowing tokenized stocks to trade on-chain, and S&P Global acquiring OpenZeppelin. Many people focus only on the “Clear Act” failing and assume regulation is basically over—but regulation isn’t simply black or white. Major legislation may not move, but innovation in smaller areas keeps progressing. Traditional finance is also quietly moving into blockchain.
So don’t be too pessimistic, and don’t be too optimistic either. What you’re seeing now is a choppy “bottoming-out” range market: pressure overhead, support below. In terms of strategy, don’t chase or panic-sell—buy low and sell high.
At 4 p.m., let’s chat in the room: “How will next week likely go, and which sectors could have opportunities?” If you’re interested, come join.
$BTC $ETH #BinanceSquare #行情复盘


king Gulfam
·
--
#FutureTradingSignals
$BULLA
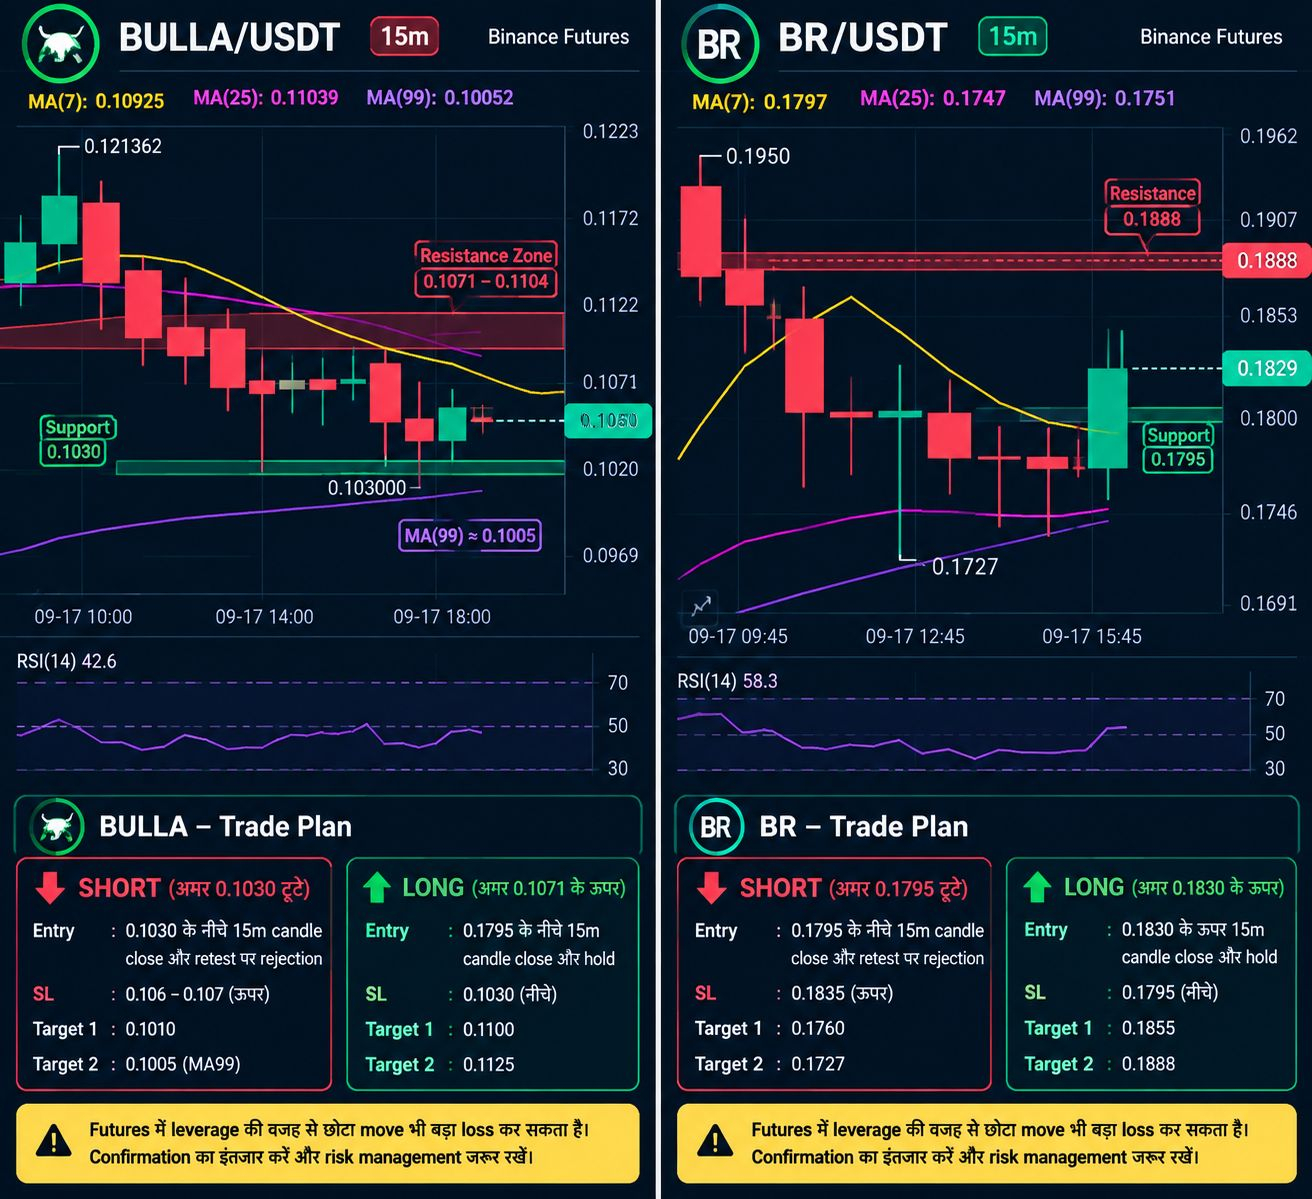
BULLA is showing bearish momentum on the 15m chart right now. Price is around 0.1050. 0.1030 support is important. If you get a candle close below it and a retest rejection, then you can look for a SHORT. Consider LONG only if there is a strong hold above 0.1071. Don’t rush into an entry right now, and please keep a stop-loss.
🔴 BULLA — SHORT
Entry: 0.1028–0.1030 below 15m close + retest
Stop Loss: 0.1060
Target 1: 0.1010
Target 2: 0.1005
$BR
In BR coin, bullish momentum is currently visible. Price is at 0.1829 and MA(7) is above. Take LONG only if there is a 15m candle close above 0.1830–0.1853. Keep stop-loss around 0.1795. If 0.1795 breaks, avoid LONG. Keep leverage low in futures and limit risk to your capital.
, A SHORT setup could form, but not immediately. The chart is showing a bounce around 0.1830.
Look for SHORT only when: there is a 15m candle close below 0.1795 and you get rejection on the retest.
SL: above 0.1835
Targets: 0.1760 → 0.1727
This is a confirmation-based setup; keep leverage low.
🟢 BR — LONG
Entry: 15m close + hold above 0.1830
Stop Loss: 0.1795
Target 1: 0.1855
Target 2: 0.1888
🔴 BR — SHORT POSITION
Entry: 15m candle close + retest below 0.1795
Stop Loss: 0.1835
Target 1: 0.1760
Target 2: 0.1727
Don’t take a short without breaking 0.1795. Keep leverage low in futures.
$SYN
$BULLA
BULLA is showing bearish momentum on the 15m chart right now. Price is around 0.1050. 0.1030 support is important. If you get a candle close below it and a retest rejection, then you can look for a SHORT. Consider LONG only if there is a strong hold above 0.1071. Don’t rush into an entry right now, and please keep a stop-loss.
🔴 BULLA — SHORT
Entry: 0.1028–0.1030 below 15m close + retest
Stop Loss: 0.1060
Target 1: 0.1010
Target 2: 0.1005
$BR
In BR coin, bullish momentum is currently visible. Price is at 0.1829 and MA(7) is above. Take LONG only if there is a 15m candle close above 0.1830–0.1853. Keep stop-loss around 0.1795. If 0.1795 breaks, avoid LONG. Keep leverage low in futures and limit risk to your capital.
, A SHORT setup could form, but not immediately. The chart is showing a bounce around 0.1830.
Look for SHORT only when: there is a 15m candle close below 0.1795 and you get rejection on the retest.
SL: above 0.1835
Targets: 0.1760 → 0.1727
This is a confirmation-based setup; keep leverage low.
🟢 BR — LONG
Entry: 15m close + hold above 0.1830
Stop Loss: 0.1795
Target 1: 0.1855
Target 2: 0.1888
🔴 BR — SHORT POSITION
Entry: 15m candle close + retest below 0.1795
Stop Loss: 0.1835
Target 1: 0.1760
Target 2: 0.1727
Don’t take a short without breaking 0.1795. Keep leverage low in futures.
$SYN

白鲨观点马来西亚
·
--
BTC falls below the 78,000 mark—today’s PPI is the “trailer” for the CPI
This morning, BTC tested the 78,000 support, dipping as low as 77,900.
The market is like a fully drawn bow, just waiting for tonight’s PPI and tomorrow’s CPI to release the string.
First, let’s talk about why PPI matters.
PPI is the Producer Price Index—basically a “leading indicator” for CPI.
If factory costs rise, it will eventually filter through to consumers.
Market expectations are PPI MoM +0.2% and YoY +1.4%.
If it comes in above expectations, it’s basically like previewing that tomorrow’s CPI won’t look good either—
the probability of further rate hikes keeps climbing, and BTC will most likely drop to test lower supports.
Conversely, if PPI is below expectations,
markets may price in optimism in advance that “the CPI could cool off,”
and the 80,000 level might be pulled back just like that.
My plan today: I’m not betting on direction—I’ll wait for the data.
I cut my position to 30%, keeping plenty of ammunition on hand, and I’ll make moves once the numbers come out.
The PPI release is tonight at 20:30, and I’ll interpret it in real time in the chat.
Want to know first how the data will affect the market? Tap my avatar to enter the chat—the code word is “PPI.”
By the way, do you think today’s PPI will beat expectations or come in below them?
Drop your bet in the comments: if it beats expectations, you lose 1; if it’s below expectations, you lose 2.
#BinanceSquare #bitcoin #PPI #加密市场 #CPI前瞻
This morning, BTC tested the 78,000 support, dipping as low as 77,900.
The market is like a fully drawn bow, just waiting for tonight’s PPI and tomorrow’s CPI to release the string.
First, let’s talk about why PPI matters.
PPI is the Producer Price Index—basically a “leading indicator” for CPI.
If factory costs rise, it will eventually filter through to consumers.
Market expectations are PPI MoM +0.2% and YoY +1.4%.
If it comes in above expectations, it’s basically like previewing that tomorrow’s CPI won’t look good either—
the probability of further rate hikes keeps climbing, and BTC will most likely drop to test lower supports.
Conversely, if PPI is below expectations,
markets may price in optimism in advance that “the CPI could cool off,”
and the 80,000 level might be pulled back just like that.
My plan today: I’m not betting on direction—I’ll wait for the data.
I cut my position to 30%, keeping plenty of ammunition on hand, and I’ll make moves once the numbers come out.
The PPI release is tonight at 20:30, and I’ll interpret it in real time in the chat.
Want to know first how the data will affect the market? Tap my avatar to enter the chat—the code word is “PPI.”
By the way, do you think today’s PPI will beat expectations or come in below them?
Drop your bet in the comments: if it beats expectations, you lose 1; if it’s below expectations, you lose 2.
#BinanceSquare #bitcoin #PPI #加密市场 #CPI前瞻


奕泽YIZZE
·
--
🧧🔥 In the tide of the digital age, steadfast belief is the key to moving forward. Follow LUCIC exclusive card dividend updates—don’t blindly follow, don’t chase trends. Amid the interweaving of technological change and market shifts, stay confident in quality assets. Let’s explore together the possibilities ahead and seize today’s long-term opportunities.
Please follow, like, and share!
Please follow, like, and share!

Log in to explore more content