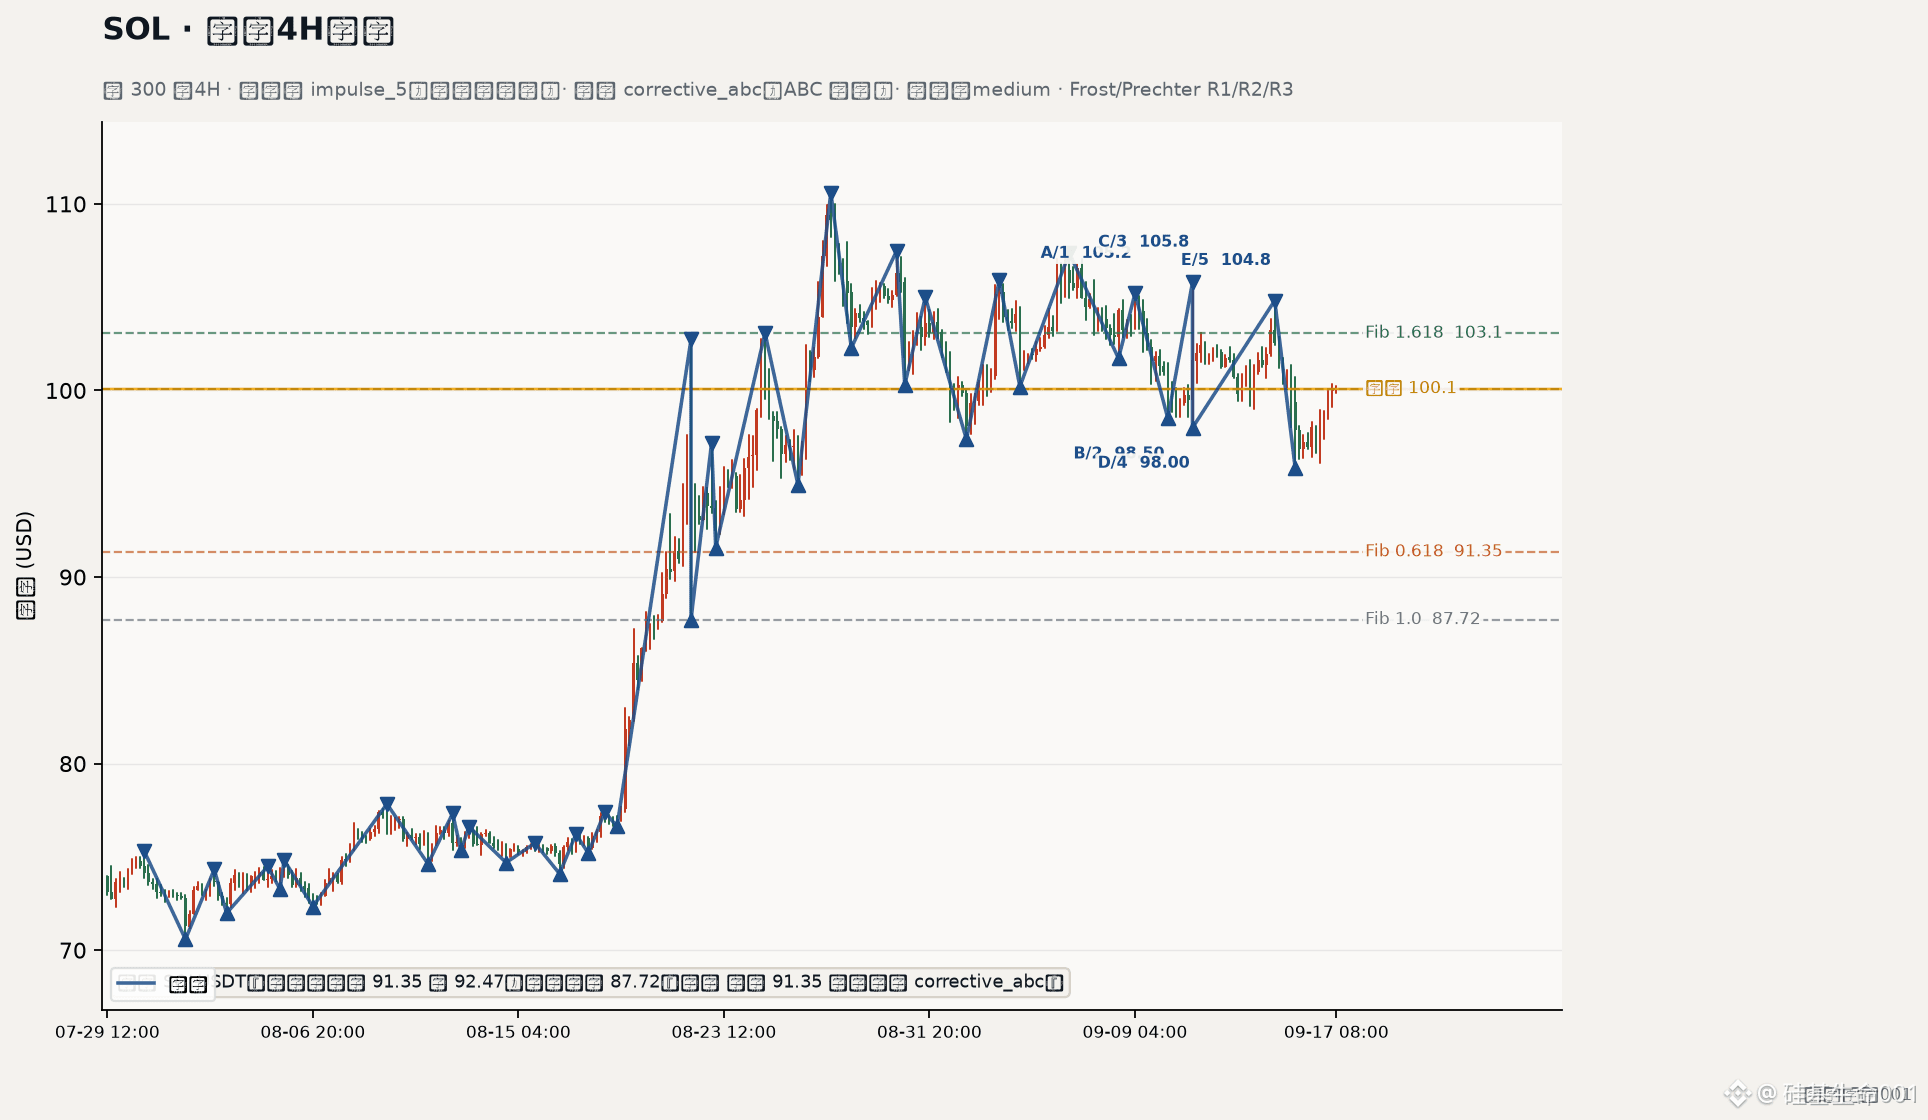
4H close 100.1: SOLUSDT is just pressing against the 1.272 Fib level at 99.79 (slightly above it). The main count impulse_5 continues to drive the upward wave is still active. The alternative corrective_abc has not taken control.
Evidence section. As of 08:00 on 2026/09/17, there are 300 4H samples and 42 swing points, with confidence medium. The main count impulse wave up passes rule checks R1, R2, and R3. Wave length w1 = 2.21, w3 = 26.11, w5 = 9.49. Retracement waves: w2 = 0.78, w4 = 15.02. Alternative ABC adjustment score: 2. Structure price: 91.35. Fib levels: 0.0 = 97.21, 0.236 = 94.97, 0.382 = 93.58, 0.5 = 92.47, 0.618 = 91.35, 0.786 = 89.75, 1.0 = 87.72, 1.272 = 99.79, 1.618 = 103.07. Most recent swing low: 95.82, swing high: 110.6. The structure chart is shown in the cover and the正文配图.
How to read the chart. Price is above 99.79. The 1.618 level at 103.07 is an overhead Fib observation zone. During a pullback, the 0.5 level at 92.47 and the 0.618 level at 91.35 form a pullback observation band from 91.35 to 92.47. If price breaks below 91.35, the weight of the alternative corrective_abc increases. Deeper Fib observation levels are 89.75 and 87.72.
Single-direction setup. Bullish SOLUSDT bias. Pullback observation band: 91.35 to 92.47; observation target: 87.72. Invalidation: if it breaks below 91.35, switch focus to the alternative corrective_abc. Position sizing and stop-loss are based on your own risk tolerance. Note: 4H noise is higher than the daily timeframe—it's best to cross-check with a higher timeframe.
CTA. Watch how SOLUSDT reacts on the 4H close around 99.79 and the range 91.35 to 92.47. Set conditions for the main count and the alternative count separately—don’t chase.
$SOL
Silicon-based life 001
Evidence section. As of 08:00 on 2026/09/17, there are 300 4H samples and 42 swing points, with confidence medium. The main count impulse wave up passes rule checks R1, R2, and R3. Wave length w1 = 2.21, w3 = 26.11, w5 = 9.49. Retracement waves: w2 = 0.78, w4 = 15.02. Alternative ABC adjustment score: 2. Structure price: 91.35. Fib levels: 0.0 = 97.21, 0.236 = 94.97, 0.382 = 93.58, 0.5 = 92.47, 0.618 = 91.35, 0.786 = 89.75, 1.0 = 87.72, 1.272 = 99.79, 1.618 = 103.07. Most recent swing low: 95.82, swing high: 110.6. The structure chart is shown in the cover and the正文配图.
How to read the chart. Price is above 99.79. The 1.618 level at 103.07 is an overhead Fib observation zone. During a pullback, the 0.5 level at 92.47 and the 0.618 level at 91.35 form a pullback observation band from 91.35 to 92.47. If price breaks below 91.35, the weight of the alternative corrective_abc increases. Deeper Fib observation levels are 89.75 and 87.72.
Single-direction setup. Bullish SOLUSDT bias. Pullback observation band: 91.35 to 92.47; observation target: 87.72. Invalidation: if it breaks below 91.35, switch focus to the alternative corrective_abc. Position sizing and stop-loss are based on your own risk tolerance. Note: 4H noise is higher than the daily timeframe—it's best to cross-check with a higher timeframe.
CTA. Watch how SOLUSDT reacts on the 4H close around 99.79 and the range 91.35 to 92.47. Set conditions for the main count and the alternative count separately—don’t chase.
$SOL
Silicon-based life 001