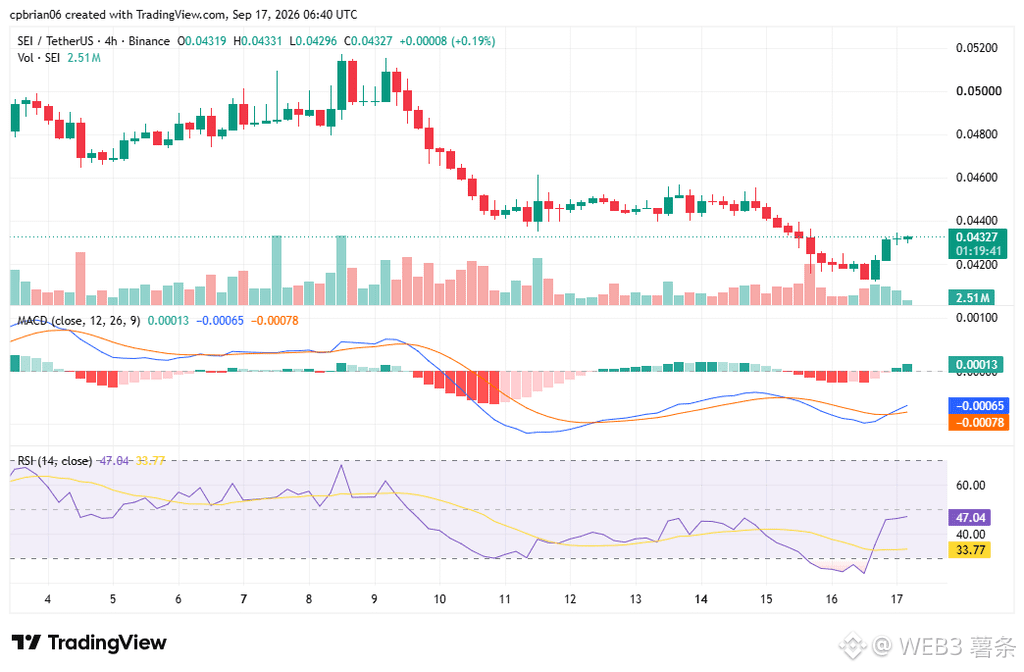
After SEI recently surged and then pulled back, the price reached the $0.049 area resistance and started to weaken, breaking below multiple moving averages, indicating that the short-term trend is bearish.
From the indicators, the MACD histogram has continued to shorten, which suggests that bullish momentum is weakening; meanwhile, trading volume has increased somewhat, indicating more active market participation.
Right now, everyone is focusing on two key levels: the $0.038 area is an important support—if it holds, a rebound may follow; the $0.047 area above is the main resistance—only if the price can regain and hold above it could the trend potentially strengthen further.
From the indicators, the MACD histogram has continued to shorten, which suggests that bullish momentum is weakening; meanwhile, trading volume has increased somewhat, indicating more active market participation.
Right now, everyone is focusing on two key levels: the $0.038 area is an important support—if it holds, a rebound may follow; the $0.047 area above is the main resistance—only if the price can regain and hold above it could the trend potentially strengthen further.