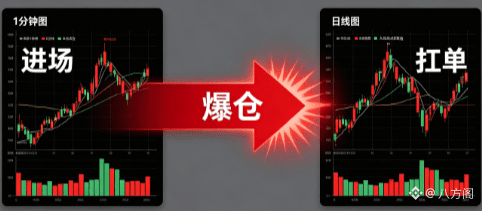
You enter on a 1-minute chart, but hold the position using the daily chart—if you don’t lose, who will?
Let me ask you a question first: When you entered, which timeframe were you looking at? A 1-minute? A 5-minute?
Most people answer: the 1-minute, because the signals are fast.
Then let me ask you another question: After you got stuck in a losing trade, which timeframe did you look at? The daily? The weekly?
Most people answer: the daily, because they want to hold for the long term.
Congratulations—you’ve found the standard setup for getting liquidated: enter with a microscope, hold with a telescope.
You enter using one timeframe, but hold using another—that isn’t trading; it’s self-deception.
Why?
Because the 1-minute chart tells you it’s time to exit, but you don’t. You go look at the daily chart for reasons: “The daily trend is still bullish; it’s fine to hold.”
Then the daily chart breaks down too, and you’re already trapped—you can’t move anymore.
The right way is: your entry and exit must use the same timeframe.
If you enter using a 1-minute chart, exit using a 1-minute chart. If the 1-minute chart tells you to stop out, then you leave—don’t look at the daily.
If you enter using a daily chart, exit using a daily chart. If the daily chart says the trend is still there, then you hold—don’t get distracted by 1-minute fluctuations.
Only by keeping the timeframe consistent will your trading logic stay consistent, and you won’t contradict yourself.
Tonight in the live room, I’ll focus on the mainstream altcoin market and demonstrate in real time: how to unify your timeframes, and how to build consistent trading rules.
If you’ve also had the problem of “enter on the 1-minute, hold on the daily,” come in.
Let me ask you a question first: When you entered, which timeframe were you looking at? A 1-minute? A 5-minute?
Most people answer: the 1-minute, because the signals are fast.
Then let me ask you another question: After you got stuck in a losing trade, which timeframe did you look at? The daily? The weekly?
Most people answer: the daily, because they want to hold for the long term.
Congratulations—you’ve found the standard setup for getting liquidated: enter with a microscope, hold with a telescope.
You enter using one timeframe, but hold using another—that isn’t trading; it’s self-deception.
Why?
Because the 1-minute chart tells you it’s time to exit, but you don’t. You go look at the daily chart for reasons: “The daily trend is still bullish; it’s fine to hold.”
Then the daily chart breaks down too, and you’re already trapped—you can’t move anymore.
The right way is: your entry and exit must use the same timeframe.
If you enter using a 1-minute chart, exit using a 1-minute chart. If the 1-minute chart tells you to stop out, then you leave—don’t look at the daily.
If you enter using a daily chart, exit using a daily chart. If the daily chart says the trend is still there, then you hold—don’t get distracted by 1-minute fluctuations.
Only by keeping the timeframe consistent will your trading logic stay consistent, and you won’t contradict yourself.
Tonight in the live room, I’ll focus on the mainstream altcoin market and demonstrate in real time: how to unify your timeframes, and how to build consistent trading rules.
If you’ve also had the problem of “enter on the 1-minute, hold on the daily,” come in.