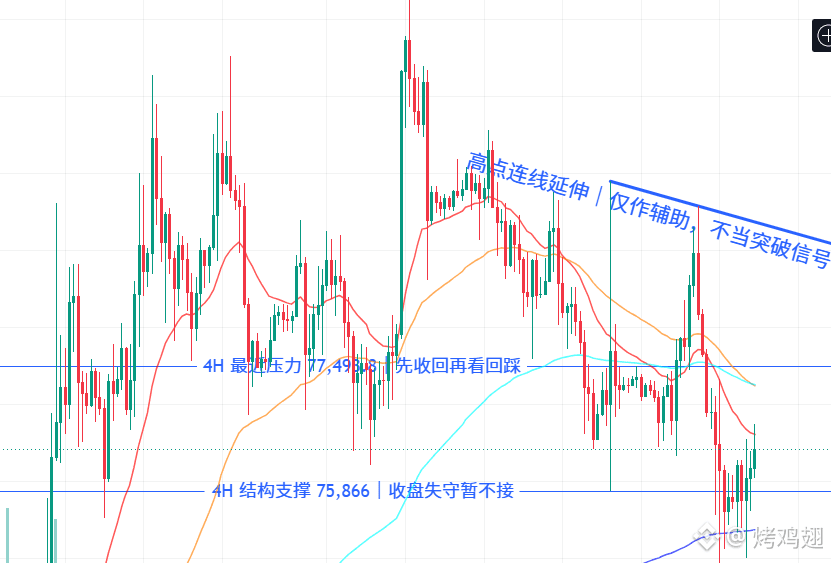
Big Cake’s latest 4-hour close is higher than the previous candle, but I still won’t treat this bounce as a reversal. What matters more now is whether the sell pressure above has truly eased up.
Pull the camera back a bit. Big Cake’s recent two confirmed highs and lows haven’t formed a consistent higher-highs/higher-lows structure yet. A local rebound that’s not strong enough isn’t proof that the bigger direction has already changed. Support comes from the confirmed 4-hour low, while resistance should be prioritized by the most recent historical high level above the close. These horizontal price areas are more worth watching than a downward-sloping trendline.
Moving averages can also help clarify the positioning: Big Cake’s full 4-hour close is 76,168, with the 20- and 50-day moving averages around 76,622 and 77,266. Price is still below both moving averages, and the rebound hasn’t shaken off the resistance overhead. RSI14 is around 43, and momentum still looks weak—I’m treating it as the supporting character.
Looking at volume specifically: the latest complete candle’s volume is about 0.46x the average volume of the previous 20 candles, and the total volume over the most recent 6 candles is about 0.62x that of the earlier 6. This volume hasn’t exceeded the average of the prior 20 candles yet, and the rebound’s volume power hasn’t caught up. Next, when price approaches resistance, watch whether volume increases in sync. If it only spikes intraday but the close falls back again, I won’t count it as an effective reclaim.
For now, I’m watching 77,494: once 4-hour closes reclaim it, then I’ll consider going long only after the subsequent 4-hour pullback reaches there and still closes above it.
Ethereum hasn’t provided a clearer edge either. First, I want to see whether the recent resistance at 2,430 can be reclaimed. Ethereum’s full 4-hour close is 2,417, which is only about 0.5% below that resistance. Volume is at about 0.48x. This room is too small to even cover a normal fluctuation, so chasing it offers poor cost-performance.
For the high and low points mentioned here, both the left and right sides need to have complete candles for comparison; the newly formed needle tip doesn’t count yet. A higher low only suggests that sell pressure in that segment has weakened. If you want to say the structure is turning stronger, you still need to see whether the prior highs can be reclaimed. During pullbacks, I don’t just check whether price touched a level—I look at which side the 4-hour close ends up on, and whether it then makes another lower low. A narrowing-volume pullback can be a clue, but it can’t on its own prove that selling has been exhausted. One big bullish candle on rising volume can’t replace the subsequent confirmation and follow-through.
Big Cake’s ATR14 is around 936—this is the recent 4-hour single-candle volatility scale, not a guaranteed target to reach. Once the pullback pattern appears, I’ll put the invalidation low, the nearest resistance, and the trading fees into the same calculation. After deducting costs, if there isn’t enough upside room, I’d rather miss the trade than try to force a 1:2-like farther target.
If the 75,866 support is broken again by a 4-hour close, I won’t enter long first. A rally intraday doesn’t count as standing firm.
$BTC $ETH
Pull the camera back a bit. Big Cake’s recent two confirmed highs and lows haven’t formed a consistent higher-highs/higher-lows structure yet. A local rebound that’s not strong enough isn’t proof that the bigger direction has already changed. Support comes from the confirmed 4-hour low, while resistance should be prioritized by the most recent historical high level above the close. These horizontal price areas are more worth watching than a downward-sloping trendline.
Moving averages can also help clarify the positioning: Big Cake’s full 4-hour close is 76,168, with the 20- and 50-day moving averages around 76,622 and 77,266. Price is still below both moving averages, and the rebound hasn’t shaken off the resistance overhead. RSI14 is around 43, and momentum still looks weak—I’m treating it as the supporting character.
Looking at volume specifically: the latest complete candle’s volume is about 0.46x the average volume of the previous 20 candles, and the total volume over the most recent 6 candles is about 0.62x that of the earlier 6. This volume hasn’t exceeded the average of the prior 20 candles yet, and the rebound’s volume power hasn’t caught up. Next, when price approaches resistance, watch whether volume increases in sync. If it only spikes intraday but the close falls back again, I won’t count it as an effective reclaim.
For now, I’m watching 77,494: once 4-hour closes reclaim it, then I’ll consider going long only after the subsequent 4-hour pullback reaches there and still closes above it.
Ethereum hasn’t provided a clearer edge either. First, I want to see whether the recent resistance at 2,430 can be reclaimed. Ethereum’s full 4-hour close is 2,417, which is only about 0.5% below that resistance. Volume is at about 0.48x. This room is too small to even cover a normal fluctuation, so chasing it offers poor cost-performance.
For the high and low points mentioned here, both the left and right sides need to have complete candles for comparison; the newly formed needle tip doesn’t count yet. A higher low only suggests that sell pressure in that segment has weakened. If you want to say the structure is turning stronger, you still need to see whether the prior highs can be reclaimed. During pullbacks, I don’t just check whether price touched a level—I look at which side the 4-hour close ends up on, and whether it then makes another lower low. A narrowing-volume pullback can be a clue, but it can’t on its own prove that selling has been exhausted. One big bullish candle on rising volume can’t replace the subsequent confirmation and follow-through.
Big Cake’s ATR14 is around 936—this is the recent 4-hour single-candle volatility scale, not a guaranteed target to reach. Once the pullback pattern appears, I’ll put the invalidation low, the nearest resistance, and the trading fees into the same calculation. After deducting costs, if there isn’t enough upside room, I’d rather miss the trade than try to force a 1:2-like farther target.
If the 75,866 support is broken again by a 4-hour close, I won’t enter long first. A rally intraday doesn’t count as standing firm.
$BTC $ETH